As practice shows, the capabilities of their own computer suit users only for the time being - sooner or later they have to resort to an upgrade. Everything is trite and simple - new versions of the OS and applications used, as a rule, require more and more resources. The easiest way to update your PC is to purchase a new system unit with modern "stuffing", which, if you have money, is not difficult. However, this is not always wise - often it is enough to resort to replacing individual components to increase productivity.
To choose an upgrade strategy, you need to find out what hardware is installed and understand what the computer lacks for more fast work- processor power, video system capabilities, memory size, read / write speed hard disk etc. But this is only one side of the coin. After purchasing a new system unit or upgrading an old one, you will need to quickly find out whether the “filling” of the system unit corresponds to the one declared at the time of purchase (without opening the unit itself, since there may be a seal on it), assess how much the performance has increased, and understand whether the computer is really stable works.
Any professional collector (and all overclocking enthusiasts) can easily solve the listed tasks, since he has in his arsenal a lot of various and highly specialized information and diagnostic tools. For an ordinary user to acquire similar decisions to nothing, however, it is still necessary to install a simple complex utility to obtain information about the hardware and test the computer. It is these programs that we will consider in this article.
Retrieving hardware data
Theoretically, any information and diagnostic utility is capable of recognizing the "stuffing" of the system unit. However, not every program is able to identify new models of processors, video cards and other hardware (it all depends on the completeness of the database and the regularity of its updating), and the amount of information on the identified components can be different - from minimal to exhaustive.
Among the solutions considered, the program has the most detailed information. AIDA64, which knows almost everything about any hardware, including the latest innovations. For example, this utility will be able to recognize the Intel 510 and 320 solid-state drives, video cards that have just appeared on the market. AMD Radeon HD 6790 and NVIDIA GeForce GT 520M, five new Quadro M mobile graphics cards from NVIDIA, etc.
Using AIDA64, you can easily find out everything about the processor, motherboard, video card, network adapter, storage devices (including the most modern SSDs) and input devices, multimedia, as well as ports, external connected devices and power management. The program is able to determine the type of flash memory, controller model (it supports reading SMART-information of controllers manufactured by Indilinx, Intel, JMicron, Samsung and SandForce) and baud rate. Moreover, the utility recognizes USB controllers 3.0 and devices compliant with this new standard.
The amount of data provided by AIDA64 is impressive - access to them is provided from the tree-like menu of the sections that unite the main modules of the program. So, through the section A computer It is easy to get aggregate information about hardware components, the system and BIOS, as well as data on processor overclocking, power supply features, the state of hardware monitoring system sensors, etc. (Fig. 1).
Rice. 1. Summary information about the computer (AIDA64)
In other "iron" sections, more detailed information is provided - so in the section Motherboard there is a detailed information about the central processing unit, motherboard, memory, BIOS, etc. In the section Display it is easy to obtain information related to graphical interface systems (in particular, data on the video adapter and monitor - Fig. 2), and in the section Multimedia learn about the multimedia capabilities of the system (multimedia devices and installed audio and video codecs).

Rice. 2. Video card data (AIDA64)
In chapter Data storage provided information on hard drives and optical drives as well as about the logical and physical structure hard drives, values and statuses of SMART parameters. You can find information about network adapters in the section Network, and about buses, ports, keyboard, mouse, etc. - in the section Devices... Also from the menu Service the panel opens AIDA64 CPUID(Fig. 3), which displays data on the processor, motherboard, memory and chipset in a compact form.
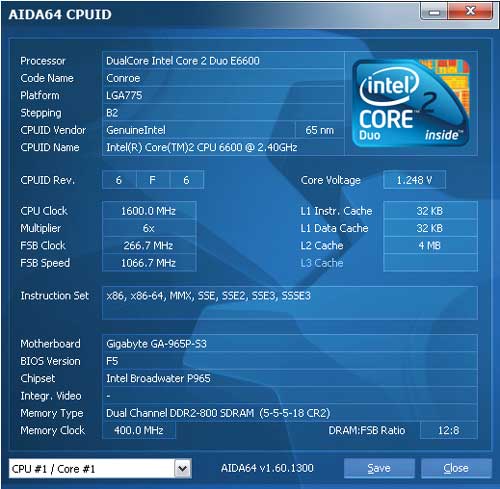
Rice. 3. Panel AIDA64 CPUID
Program SiSoftware Sandra is also very informative and allows you to get comprehensive information about almost all hardware components computer system... In particular, the utility displays summary data about the computer as a whole (Fig. 4) - that is, basic information about the processor, motherboard, chipset, memory modules, video system, etc. (tab Devices, pictogram System information).
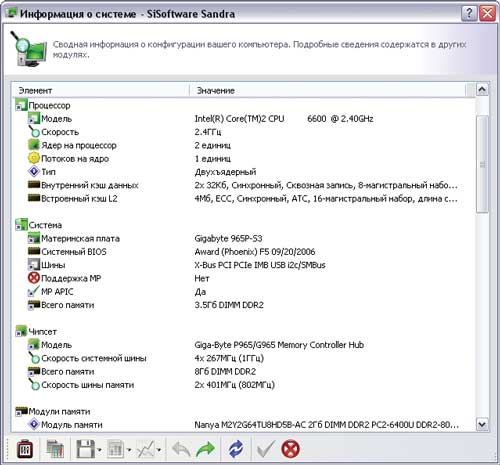
Rice. 4. Computer Summary (SiSoftware Sandra)
Along with summary information, in the tab Devices the utility also provides more detailed information about the motherboard and processor, display and video adapter (Fig. 5), memory, buses and devices installed in them, disks, ports, mouse, keyboard, sound card and so on. As for the readings of various kinds of monitoring sensors, in order to obtain them, it will be necessary to launch not an informational, but a diagnostic module Environment Monitor(tab Instruments). This module provides display of text and graphic information CPU temperature, fan speed, voltage, etc.

Rice. 5. Video System Data (SiSoftware Sandra)
Utility PC Wizard provides access to information about the main hardware modules installed in the computer: motherboard, processor, video card, memory, I / O ports, drives, printers, multimedia devices, printers, etc. All this data is available on the tab Iron... By activating the pictogram on it General information about the system, you can determine in one click what exactly is in system unit(fig. 6) - which motherboard, which processor, etc. Other tab icons Iron help get more detailed information about accessories (fig. 7); the amount of data provided is quite sufficient for the average user. Also, through the menu Instruments → Overclocking information you can find out whether some of the system components (processor, bus or memory) have been overclocked, and if so, to what limits, as well as take readings from some sensors.
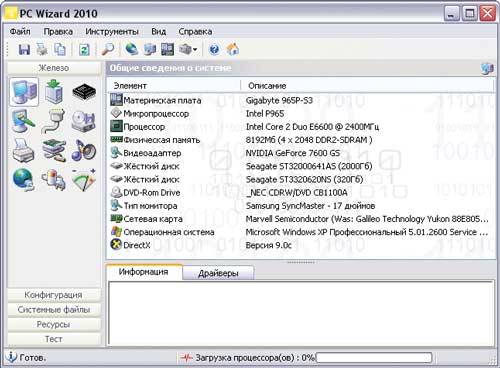
Rice. 6. Aggregate information about the computer (PC Wizard)
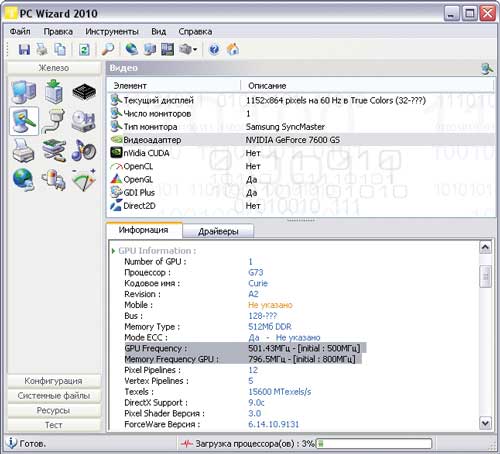
Rice. 7. Data on the graphics subsystem (PC Wizard)
Utility HWiNFO32 will also allow you to learn a lot of interesting things about the iron "stuffing" of the computer. Immediately after launch, it starts diagnostic studies and in a matter of seconds displays a window System Summary with a compact display of data on the processor, motherboard, memory, chipset, disks, etc. (Fig. 8). This window can be called on the screen while working with the utility - by clicking on the button Summary... In addition, HWiNFO32 displays detailed information about the processor, motherboard (Fig. 9), memory, video adapter and more in the appropriate tabs - Central Processors, Motherboard, Memory, Video Adapter etc. The data on the processor, memory modules, motherboard, buses and disks are quite detailed, information on other devices is more modest. If necessary, it is easy to get the readings of the sensor sensors installed on the motherboard (temperature, voltage, etc.) by clicking on the button Sensors.

Rice. 8. Summary information about the computer (HWiNFO32)
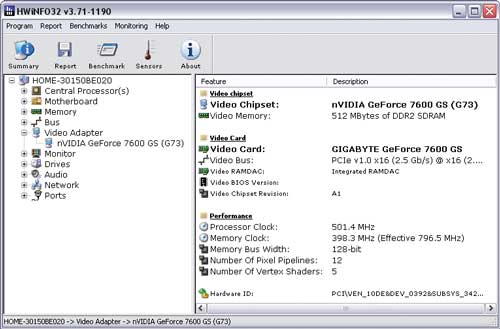
Rice. 9. Graphics card data (HWiNFO32)
Program Fresh diagnose allows you to find out information about any iron components, however, not always detailed. For example, in the tab Hardware System you can find out about the motherboard, processor, cache memory, buses, BIOS, CMOS memory, etc. Section Device contains information about the video card (fig. 10), peripherals(keyboard, printer, monitor, optical drives, etc.) and ports. In chapter Multimedia combined data on various multimedia devices, DirectX, audio and video codecs.

Rice. 10.Video card data (Fresh Diagnose)
Performance evaluation
Before upgrading, you need to assess the performance of the computer and its individual components in order to understand which hardware needs to be replaced immediately, and which components can wait until better times (after all, in times of crisis, not everyone decides on a complete modernization). It is quite easy to do this by performing a couple of specific benchmarking tests in the environment of a suitable diagnostic utility. After buying a new computer or upgrading an old one, it also does not hurt to conduct testing to make sure that the computer has become more productive. Of course, you can feel the result of modernization during routine work in applications, but for the sake of completeness, it's best to verify performance improvements with dedicated tools.
When conducting tests, in order to obtain a more objective assessment, it is better to close all applications, do not use the mouse and keyboard, run the same test (in the same version of the utility) several times and focus on the average result. In addition, it should be borne in mind that the same synthetic tests in different utilities implemented in a far from identical way, so the programs show different results. And the results obtained should not be taken literally, since they do not reflect real performance, but only indicate the level of performance when performing strictly specific tasks. Nevertheless, conducting such testing allows us to understand how outdated the hardware components installed in your computer are in comparison with reference samples, as well as assess the level of performance before and after the upgrade, which we are interested in within the framework of this article.
Of greatest interest from the testing point of view are the AIDA64 and SiSoftware Sandra programs, some benchmakers of which are used even by professionals in different hardware testing methods. The capabilities of the other utilities considered in this article are limited in this regard, although some test functionality is also provided in them.
In a programme AIDA64 a wide range of benchmarking tests are presented. So, in the section Test 13 synthetic tests are combined, the first four of which evaluate memory performance - read / write / copy speed (Fig. 11), and also measure latencies (testing the average time the processor reads data from RAM). The rest of the tests from this section evaluate the processor performance in integer and floating point operations, when creating ZIP archives, when performing encryption using the AES encryption algorithm, etc. (CPU Queen, CPU PhotoWorxx, CPU ZLib, CPU AES, CPU Hash, FPU VP8, FPU Julia, FPU Mandel, FPU SinJulia). All benchmarks compare performance against other systems, including the newest ones.

Rice. 11. Assessment of processor performance (CPU Queen test; AIDA64)
Through the menu Service three more benchmarking tests are available: Disc test, Cache and memory test and Monitor diagnostics... The disk test measures the performance of hard disks, solid state drives, optical drives etc. The Cache and Memory Test measures the bandwidth and latency of the processor and memory caches (Figure 12). In the test Monitor diagnostics the quality of display of LCD and CRT monitors is being checked.

Rice. 12. Test cache and memory (Cashe & Memory Benchmark; AIDA64)
In terms of testing for a wide range of users, still more interesting program SiSoftware Sandra, with which you can not only evaluate the performance of the PC in comparison with other reference computer configurations, but also test the computer for the need to upgrade it. Modules designed for testing the most important computer subsystems are grouped under the tab Benchmark tests... A whole group of synthetic benchmarks are designed to test the processor - arithmetic and multimedia benchmarks, multi-core efficiency benchmarks, power efficiency benchmarks, cryptographic performance, and GPGPU cryptography. Several tests are responsible for testing physical storage- These include a file system test, as well as test modules for physical disks, removable / flash drives, CD-ROM / DVD and Blu-ray optical drives. Tests for testing memory are provided: memory bandwidth test, memory latency test, and cache and memory test. In addition, there are tests to assess the rendering speed and video memory performance, audio / video encoding / decoding test, network bandwidth test, Internet connection speed assessment test, etc. When testing a number of components (processor, RAM, etc.), the results are given in comparison with reference models that are more similar in characteristics. At the same time, it is possible to independently choose standards for comparison, including the most modern ones (Fig. 13), which is very convenient and allows you to quickly understand how outdated the hardware components installed in the computer are and which models are better to replace them with.
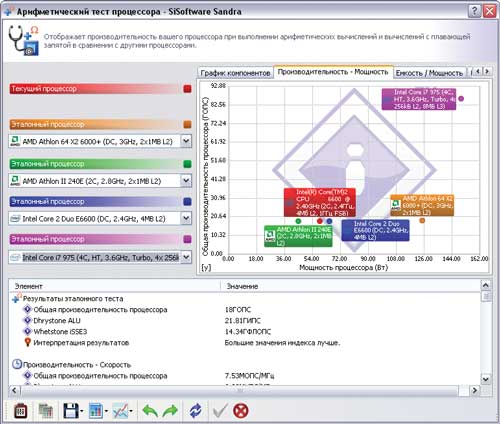
Rice. 13. Evaluation of processor performance
(arithmetic test; SiSoftware Sandra)
Two interesting test modules are presented in the tab Instruments are modules Performance index and Analysis and recommendations... Using a test Performance index the overall performance of the computer is assessed during the arithmetic and multimedia tests of the processor, the determination of the memory bandwidth, as well as testing of physical disks and a video card (Fig. 14). Reference Models components for comparison are selected by the program or by the user. Module Analysis and recommendations provides a detailed analysis of the PC for a possible upgrade. At the end of this analysis, the program gives a list of recommendations on which of the hardware components is best to replace in order to improve performance (Fig. 15), and draws attention to possible problems(for example, the complexity of adding memory due to the occupancy of all slots, too high fever processor (and suggests checking the cooling), etc.).

Rice. 14. Assessment of the overall performance of the computer (SiSoftware Sandra)
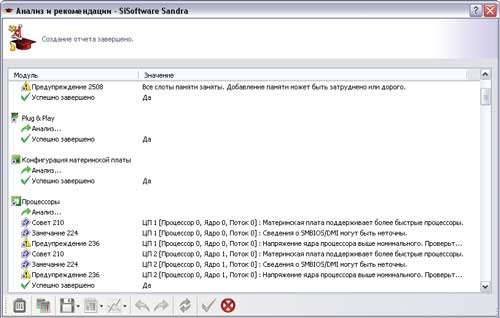
Rice. 15. Analysis of the computer for an upgrade (SiSoftware Sandra)
Utility PC Wizard also includes certain functionality for testing hardware (tab Test). With its help, you can visually assess the overall performance of your computer (icon Global Performance) in comparison with other configurations and according to the test results, to understand which of the subsystems in terms of performance significantly falls short of the selected one (from preset list) of the reference sample - that is, they need updating, and which ones turn out to be quite at the level (Fig. 16).

Rice. 16. Assessment of the overall performance of the computer (PC Wizard)
There is also a number of synthetic tests in the arsenal of PC Wizard, which allow assessing the performance of the processor, L1 / L2 / L3 caches and memory in general (bandwidth, timing), as well as the video subsystem. hard disk, an optical drive, etc. In particular, the processor is provided with basic tests Dhrystone ALU, Whetstone FPU and Whetstone SSE2, which allow assessing its performance in integer and floating point operations. The test results are displayed in text and graphical form, in a number of tests it is possible to compare the results obtained with the test results of the selected reference subsystem (Fig. 17).

Rice. 17. Testing the processor (PC Wizard)
Utility HWiNFO32 is able to evaluate the performance of the processor (CPU, FPU, MMX), memory and hard disk during express testing (button Benchmark). Test results are presented in two versions - in numerical form and in the form of a comparative diagram. The diagram contains many reference components, including modern ones, so it is easy to understand how much the processor (or other component) installed in the computer is inferior in performance to modern models (Fig. 18).
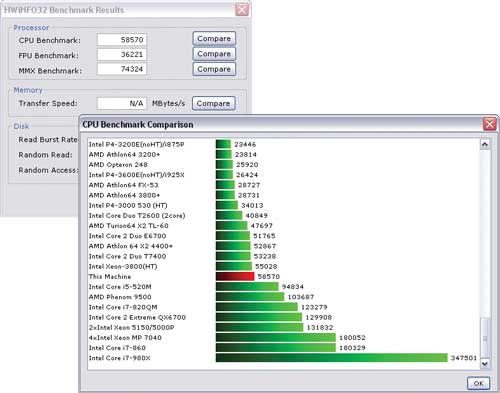
Rice. 18. Processor Performance Assessment (HWiNFO32)
Program Fresh diagnose has a toolkit for determining the performance of individual components of the system. These are seven synthetic test modules in the section Benchmarks... They can be used to evaluate the performance of the processor (Whetstone, Dhrystone and multimedia tests), memory, video system, hard drives, optical drives and network adapter... The test results are compared with the base systems and presented in the form of visual histograms. True, they are not very useful, in our opinion, since outdated reference systems are selected for comparison (Fig. 19).

Rice. 19. Processor Testing (Fresh Diagnose)
Checking your computer for stability
Unfortunately, it is not a fact that the updated computer will be stable in operation. Why? There are many reasons - for example, the power supply unit may not cope well with the increased load due to the replacement of the processor or video adapter with newer models.
If such a picture takes place, then the situation should be dealt with as soon as possible - that is, before there are obvious signs of instability in the form of a blue screen of "death", etc. This means that you need to find out the temperature of the processor, motherboard and other important hardware and understand whether any component overheats under load, and also evaluate how the computer behaves in general under stress conditions. This can be done by stress testing.
Most stability tests place an intensive computational load on various CPU units, system memory, GPU and set system logic- that is, make the computer work under stressful conditions. Unfortunately, none of these tests by themselves guarantee 100% system stability, but if the test detects a failure in the system or has not been completed, then this is a clear signal that you need to pay attention to the hardware.
Provided in AIDA64 system stability test (available through the menu Service) is intended for stress testing the processor (testing of cores separately is allowed), memory, local disks, etc. (Fig. 20). The test results are displayed on two graphs: the upper one records the temperature of the selected components, the lower one - the processor load level (CPU Usage) and the clock skip mode (CPU Throttling). Mode CPU Throttling it is activated only in case of overheating of the processor, and it should be understood that activating this mode during testing is an alarm signal calling to pay attention to the operation of the cooling system. During testing, the heating of the system is monitored by continuously monitoring the temperature.

Rice. 20. Processor stress testing (AIDA64)
In addition to the temperature, the graphs of which are displayed on the first tab during stress testing, the program provides other useful information on other tabs - about the fan speed, voltage, etc. It should be borne in mind that the system stability test in AIDA64 can last indefinitely, so it is stopped manually, making sure that everything works fine (after 30 minutes), or when suspicious results are detected (for example, severe overheating of one of the components).
Using the stability test SiSoftware Sandra(tab Instruments), you can also stress testing (Fig. 21). It will allow you to navigate in relation to the stability of the system and identify it weak spots by analyzing the operation of the processor, memory, physical disks and optical drives, power efficiency, etc. Testing lasts for a specified period of time or without taking into account it - in this case, the number of times the selected test modules are run is indicated. During testing, the utility monitors the state of the system and stops the process when errors appear or in case of overheating (critical temperatures are set by default or manually).

Rice. 21. Stability test (SiSoftware Sandra)
Utility features PC Wizard in terms of testing the system for stability (test System Test Stability from the menu Instruments) are limited to testing the processor and motherboard. During testing, the processor is maximally loaded and in such conditions it works for a long time, during which the temperatures of the processor and motherboard are measured at a certain frequency, and the results are displayed on a graph (Fig. 22).

Rice. 22. Testing the processor for stability (PC Wizard)
A quick tour of the utilities
AIDA64 (Extreme Edition) 1.60
Developer: FinalWire Ltd
Distribution size: 11.7 MB
Price: US $ 39.95
AIDA64 program - updated version well-known information and diagnostic solution EVEREST, designed for diagnostics of hardware and software computer resources and versatile testing of a computer. The utility can be run from a hard disk, CD / DVD / BD disks, and also from flash drives. The program is presented in two editions: AIDA64 Extreme Edition and AIDA64 Business Edition, AIDA64 Extreme Edition is designed for home users. The utility is regularly updated and supports the vast majority of modern models.
SiSoftware Sandra 2011 (Lite)
Developer: SiSoftware
Distribution size: 53.3 MB
Price: free (for personal and educational use)
SiSoftware Sandra Lite is the best free diagnostic information software. It provides detailed information about the computer and any of its hardware and software components, and also allows you to test the PC for performance, the need for an upgrade, etc. The utility can be used to analyze, diagnose and test a PDA or smartphone. The program is released in several editions; for home use, the capabilities of the free edition of SiSoftware Sandra Lite are sufficient. The utility is updated regularly enough and supports the vast majority of modern models.
PC Wizard 2010.1.961
Developer: CPUID
Distribution size: 5.02 MB
Price: is free
PC Wizard is an information and diagnostic utility used to diagnose hardware and software components and conduct versatile testing. In the basic version, the program is launched from the hard disk, it is possible to boot from portable devices- for example from a flash drive (special Portable version PC Wizard). The utility is not updated as often as we would like ( Last update of August 2010), although it supports many modern models (of course, there is no talk of new products).
HWiNFO32 3.71
Developer: Martin Malik
Distribution size: 2.26 MB
Price: is free
HWiNFO32 is an information diagnostic utility that allows you to get detailed information about the PC hardware and test the performance of the processor, memory and hard drives... The program is updated monthly - as a result, all new items that have appeared on the market are included in its database in a timely manner. There is a special portable edition of the utility that can be run from a removable USB drive or other portable device.
Fresh Diagnose 8.52
Developer: FreshDevices.com
Distribution size: 2.08 MB
Distribution method: freeware (http://www.freshdiagnose.com/download.html)
Price: free (registration is required; in the unregistered version, the use of tests is impossible)
Fresh Diagnose is an information diagnostic utility designed to obtain information about all hardware and software components of a PC, as well as to test it. The program is regularly updated and supports many modern models, but among its shortcomings is a poorly thought-out interface and poor-quality Russian-language localization (therefore, it is wiser to use it with an English-language interface).
There are situations when you need to find out the exact model of a video card or any other component. Not all necessary information can be found in the device manager or on the hardware itself. In this case, come to the rescue special programs, which help not only to determine the model of components, but also to obtain a lot of additional useful information. In this article, we will look at several representatives of such software.
Both advanced users and beginners will be able to use this program. It helps not only to obtain information about the state of the system and hardware, but also allows you to carry out some tuning and check the system with various tests.

Everest is distributed absolutely free of charge, does not take up much space on your hard disk, has a simple and intuitive interface. Receive general information you can directly in one window, but more detailed data are in special sections and tabs.
AIDA32
This representative is one of the oldest and is considered the progenitor of Everest and AIDA64. The program has not been supported by developers for a long time, and updates are not released, but this does not prevent it from properly performing all its functions. With this utility, you can instantly get basic data about the state of the PC and its components.

More detailed information can be found in separate windows, which are conveniently sorted and have their own icons. You don't need to pay anything for the program, and the Russian language is also present, which is good news.
AIDA64
This product is designed to help diagnose components and conduct performance tests. popular program... It contains all the best from Everest and AIDA32, improved and added several additional functions that are not available in most other similar software.

Of course, you will have to pay a little for such a set of functions, but this will only need to be done once, there are no subscriptions for a year or a month. If you cannot decide on a purchase, then a free one is available on the official website. trial version with a period of a month. For such a period of use, the user will definitely be able to draw a conclusion about the usefulness of the software.
HWMonitor
This utility does not have such a wide range of functions as the previous representatives, but it has something unique of its own. Its main task is not to show the user all the detailed information about his components, but to allow him to monitor the state and temperatures of iron.

The voltage, loads and heating of a specific element are displayed. Everything is divided into segments to make it easier to navigate. The program can be downloaded absolutely free of charge from the official website, but there is no Russian version, but even without it, everything is intuitive.
Speccy
Perhaps one of the most extensive programs presented in this article in terms of its functionality. It combines a wide variety of information and the ergonomics of the placement of all elements. Separately, I would like to touch upon the function of creating a system snapshot. In other software, it is also possible to save the results of tests or monitoring, but most often this is only the TXT format.

All the features of Speccy simply cannot be enumerated, there are really many of them, it is easier to download the program and view each tab yourself, we assure you that learning more and more new about your system is a very entertaining business.
CPU-Z
CPU-Z is a highly targeted software that is focused only on providing the user with data about the processor and its state, conducting various tests with it and showing information about the RAM. However, if you need to get just such information, then additional functions are simply not needed.

The developers of the program are the CPUID company, whose representatives will be described in this article. CPU-Z is available for free and does not require a lot of resources and hard disk space.
GPU-Z
Using this program, the user will be able to get the most detailed information about the installed graphics adapters... The interface is designed as compactly as possible, but at the same time all the necessary data fits on one window.

GPU-Z is perfect for those who want to know everything about their graphics chip. This software is distributed absolutely free of charge and supports the Russian language, however, not all parts are translated, but this is not a significant drawback.
System Spec
System Spec - developed by one person, freely distributed, but there have been no updates for a long time. This program does not require installation after downloading to your computer, you can use it immediately after downloading. It provides a large amount of useful information not only about the hardware, but also about the state of the system as a whole.

PC Wizard
Now this program is not supported by the developers, therefore, no updates are released. However, the latest version can be used comfortably. PC Wizard lets you know detailed information about components, track their condition and conduct several performance tests.

The interface is designed quite simply and clearly, and the presence of the Russian language helps to quickly understand all the functions of the program. You can download and use it absolutely free.
SiSoftware Sandra
SiSoftware Sandra is paid for, but for its money it provides the user with a wide range of functions and capabilities. Unique in this program is that you can connect to a computer remotely, you just need to have access for this. In addition, it is possible to connect to servers or just to a local computer.

This software allows you to monitor the state of the system as a whole, to find out detailed information about the hardware. You can also find sections with installed programs, various files and drivers. All this can be edited. loading latest version in Russian is available on the official website.
BatteryInfoView
A highly targeted utility, the purpose of which is to display data about the installed battery and monitor its condition. Unfortunately, she can't do anything else, but she completely fulfills her task. Flexible configuration and a number of additional functionality is available.

All detailed information is opened with one click, and the Russian language allows you to master the work of the software even faster. You can download BatteryInfoView from the official website for free, there is also a crack with installation instructions.
Is not full list of all programs that provide information about PC components, however, during testing they showed themselves quite well, and even a few of them will be quite enough to get all possible detailed information not only about components, but also about the operating system.
Have you faced such a situation - the computer starts malfunctioning or shuts down completely. What is the problem? It turns out that you do not always need to contact service center... Try using specialized software. The use of programs is useful not only in cases of malfunctions. Consider best programs to determine the hardware of the computer, and when to use them.
What is this software for?
Have you ever encountered a situation that you need to know some of the characteristics of a PC? And this is not the only reason to use such software. Hardware for detecting hardware is useful if:
- Drivers are updated;
- To find out HDD temperature or CPU;
- When the system slows down and freezes.
Sometimes you need to know the hardware model or version. Users do not remember such parameters. They may not be found in the documentation. Let's consider what software is needed in such situations.
Speccy
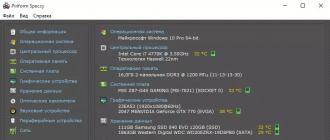
The official website of the program: filehippo.com/download_speccy. On home page there will be a link to download the "exe" file with the program. Installation is simple, and will not cause any difficulties even for beginners. Shows information about RAM, sound devices, CPU and motherboard temperatures. Works on all versions of Windows.

The utility window displays hardware models and small icons showing temperatures. By clicking on them twice, see the changes that have occurred in five minutes. The utility will not be released by the developers as a professional monitoring tool, but you can find out that it's time to change the thermal paste on the video card using the program.
Speccy Features:
- Shows detailed information about the characteristics of the PC and its devices;
- It uses system tools for diagnostics.
The program for determining the hardware of the computer Aida64
Download the program from the official Internet project: aida64.com/downloads/latesta64xe.

It was formerly called Everest, but was renamed by the developers to AIDU. Shows detailed information about the system and what is installed. Aida64 is configured for advanced PC diagnostics. Has tests for RAM, CPU, video, HDD.
Important! When checking your computer, or before buying a new one, take a stress test. If the device has worked for at least fifteen minutes and does not appear blue screen- everything is fine.
AIDA 64 characteristics:
- Shows information in real time;
- Creates a detailed report;
- Completely in Russian.
Aida can:
- Edit startup programs. It is because of them that the PC starts to work slower;
- Section showing all connected devices. This will help determine its model and find the correct driver. Shows the link from where to download it.
HWInfo
The official website of the utility is www.hwinfo.com. Of the features, we note the ability to download the installer of the program, and the availability of a portable version. Once launched, HWInfo displays general information about the PC.

Small but powerful program... If you look at the temperature sensors, then, in addition to the current indicators, the program will show the maximum allowable parameters for the equipment. If they are close to the maximum, think about it. Works with all versions of Windows.
Important! It is convenient to update drivers, since the utility publishes a link to the manufacturer's website.
GPU-Z
If the video card malfunctions, pay attention to this application. It supports most of the existing video adapters. Shows information about frequency, use of RAM resources, load. Defines memory timings and BIOS version of the motherboard. Download it from the site cpuz.ru/gpuz_download.htm

Peculiarities:
- Works only with a video card;
- The main feature is the monitoring of the basic values of the device;
- Minimum settings.
CPU Thermometer
Download it from cputhermometer.com

Suitable for those who know what a normal CPU temperature is. Performs one function - it shows the percentage of loading processor cores. Minimizes to the system tray and starts up with the OS.
CPU-Z
Official website of the program: cpuid.com/softwares/cpu-z.html

The utility will measure the CPU temperature, evaluate its efficiency and resistance to overloads. The creators have implemented a lot of important functions... In addition to testing, the utility receives information about the motherboard, each RAM and GPU. Creates a report exported to txt or html format.
Peculiarities:
- Shows the temperature of the CPU;
- Detailed information about the hardware;
- Benchmark (solving a problem to determine the performance) of the CPU;
- Works on Windows and Android.
Monitor Temperatures with Core Temp
Download the program from the site: alcpu.com/CoreTemp/

Receives information from PC temperature sensors. Checks if the system is using a lot of CPU. A special feature of the program is the overheating protection function. She will report this and take certain actions. Will put the PC into sleep mode, or turn it on (can be configured as an option).
Shows the values of the CPU core, frequency and voltage on the chip. It differs from similar programs by the ability to display the maximum heating temperature depending on the processor model. Even if you are a novice user, looking at the minimum and maximum values will understand if the temperature readings are normal.
Advantages:
- Consumes few system resources;
- Intuitive interface;
- Protects the system from overheating;
- The ability to search for new drivers;
- BIOS update;
- Advanced diagnostic setup;
- Free.
Open Hardware Monitor
Located at: openhardwaremonitor.org/downloads/

Dwaremonitor connects to sensors on the motherboard, so it shows accurate and detailed information. The window displays the current and maximum temperature readings. Looking at the values, it becomes clear whether the equipment has a tendency to overheat.
Main characteristics:
- Informs about an increase in temperature;
- The results are logged;
- Support for all existing processors, information about which comes from special online databases;
- Compatible with all versions of Windows.
SpeedFan
The utility is located at speedfan.ru.softonic.com/

Displays the temperature of the CPU, SMAPT drive and other parts of the PC. Distinctive feature- regulation of the cooler rotation speed. For this, it will be used. SpeedFan prevents overheating and helps to reduce noise levels.
Important! For correct setting try different options. The main thing is to watch the temperature.
Peculiarities:
- Information about the temperature is shown in the system tray (near the clock);
- The number of fan revolutions is set in the menu.
Output
Of the programs listed above, use a combination of Core Temp and Hardware Monitor. The first will protect against overheating. The second will show detailed information about other parameters. Use SpeedFan to reduce noise or optimize cooling. AIDA and CPU-Z are suitable for testing hardware. Against the background of their counterparts, they show the most truthful results. For those who don't like complicated software, use a minimalist CPU Thermometer.