transcript
1 Ministry of Education and Science Russian Federation Federal State Budgetary Educational Institution of Higher Professional Education "Pacific State University" N. D. Berman MS VISIO 2010: FUNDAMENTALS OF WORK Approved by the publishing and library council of the university as a textbook
2 UDC /94 LBC Z B 50 Reviewers: Department of Information Technologies and Systems Department of Dr. Phys.-Math. Sciences, Professor K.A. Chekhonin) Professor, Doctor of Physics and Mathematics. E. N. Lomakina Scientific Editor Candidate of Physical and Mathematical Sciences, Associate Professor E. G. Agapova Berman, N. D. B 50 MS VISIO 2010: basics of work: study guide allowance / N. D. Berman. Khabarovsk: Tikhookean Publishing House. state un-ta, s. ISBN The textbook is written for one of the sections of the course "Informatics". IN study guide the basic methods of working in the MS Visio graphics editor MS Visio 2010 program allows you to quickly and efficiently create both simple diagrams and complex drawings and diagrams using built-in templates. The tutorial contains all the information needed to master the interface of MS Visio 2010, as well as to acquire skills in working with the basic tools of the program. A large number of illustrated accompaniment provides clarity and accessibility of the presentation of the material, which makes the learning process more effective. It is intended for university students of all specialties studying the discipline "Informatics", as well as for all those interested in this section of applied informatics. ISBN UDC /94 BBC Z Berman N.D., 2014 Pacific State University, 2014
3 INTRODUCTION Microsoft has a product that belongs to office applications, but is not sold as part of MS Office. However, his fame is quite high and he is very popular. Created by Visio in 1990, it was introduced to the market under the Microsoft trademark and then began to develop in parallel with office applications. We are talking about Microsoft Visio, a business graphics program. The scope of this program is very diverse. This is the management of business processes, projects, networks, and business data analysis, building layouts, networks for various purposes, and so on. This versatility may seem to be detrimental to the product, since each of these tasks has powerful, specialized systems that allow similar functions to be performed. But just like Excel compared to data processing systems, Visio is a simpler and often more convenient tool than specialized systems for performing preliminary analysis of information and preparing outlines for future projects. The visualization of information in Visio is based on the use of a variety of shapes grouped into different categories. A large number of templates allows you to implement a variety of tasks. Visio 2010 is the first version of Visio with a ribbon user interface. The Ribbon in Visio is well organized and easy to use because the purpose of the Ribbon is to present sets of related features visually, and Visio is a visual product. The main purpose of the tutorial is to develop skills in MS Visio 2010 to create various types schemes. The tutorial covers the basic methods of working with a Visio document, creating diagrams using templates, methods and techniques for working with shapes, as well as text blocks. 3
4 INTRODUCING THE PROGRAM MS Visio 2010 editions Microsoft Visio 2010 differs significantly from previous versions of the program. The most significant changes have been made to the user interface, with traditional menu bars and toolbars replaced by a tabbed ribbon. Other Office programs used the ribbon in 2007, but not Visio. MS Visio is available in three editions: Standard, Professional and Premium. The basic edition of Visio Standard 2010 offers a basic set of tools for creating various diagrams and diagrams, the Visio Professional 2010 edition is distinguished by the creation of dynamic diagrams and diagrams based on a set of source data. With Visio Professional 2010, you can connect diagrams to data sources in real time and share finished diagrams over the Internet. Visio Premium 2010 includes an enhanced set of graphical tools and tools for enterprise-wide diagramming workflow management. New features in the base edition of Visio Standard 2010 include the Quick Shapes tool, Auto Align & Space, and a new mechanism for inserting and deleting shapes. New containers and callouts make it easier to organize and style charts. The Visio Professional 2010 edition is based on Visio Standard 2010, the difference is the ability to link diagrams to data sources and the ability to publish ready-made diagrams using Visio Services, which allows you to view dynamically updated diagrams through SharePoint portals, even if Visio is not installed on your computer. The Professional Edition also includes an expanded set of templates, including detailed network diagrams, utility networks, wireframe diagrams, and database software diagrams. Visio Premium 2010 includes all the features of Visio Professional 2010 plus advanced workflow controls: new diagram templates for SharePoint workflow procedures, diagram templates 4
5 BPMN (Business Process Modeling Notation) and Six Sigma business processes. SharePoint procedure diagrams can be exported to SharePoint Designer 2010 business process designer for further development and implementation. The new Subprocess feature allows you to break down large business processes into smaller pieces that can be easily controlled and reused. The diagram verification mechanism helps to ensure that there are no defects or hidden inconsistencies left in the diagram. This tutorial is based on the Premium edition, so the ribbon elements may differ from other editions. Features that can only be used with a specific edition of Visio 2010 will be further specified. Basic concepts and terms Sample. An object in a Visio shape set. To create a diagram using Visio, use the samples that come with the program or have been downloaded from the Internet. Set of elements. Collection of samples. Figure. An object on a Visio drawing page. Shapes are created by dragging swatches and stencils onto the drawing page; however, figures can also be created in other ways. The figure can be very simple: a line, a polygon, an image. However, it can also be a fairly complex object that changes its appearance or behavior when data values change, when its position on the page changes, or when the properties of another shape change. Sample. A Visio drawing that includes one or more pages with preset sizes and units. A template may also include one or more stencils, background pages, and layouts; the pages in it can contain shapes or text. The template may include special software that works only in it. Workspace. A collection of Visio windows and their settings. At a minimum, the workspace consists of the document window and zoom settings for the pages in the document; often it also includes a Shapes window with one or more stencils. The program saves the workspace, 5
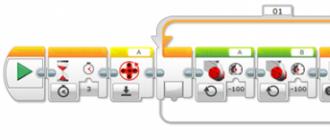
6 which is visible on the screen in any open document and when saving this document. As a result, the next time you open this document, the used workspace is restored. Application Window and Interface Elements Microsoft Visio 2010 is the first version of Visio that uses what Microsoft calls the user interface, or ribbon. Using the ribbon in the Microsoft Office Fluent user interface, you can quickly find the commands you need. The commands on it are organized into logical groups, collected on tabs. Each tab is associated with a specific type of action. Let's list the main elements of the user interface of the MS Visio 2010 program (Fig. 1): - the title bar of the window containing: the Visio icon is used to open the system menu containing commands for managing the application window; the Quick Access Toolbar, which contains frequently used commands that you can add or remove buttons on the Quick Access Toolbar by clicking the button; the file name of the open drawing, the newly created file in Visio is called Document1; application window control buttons (minimize, restore, close); - tabbed ribbon for accessing controls; - the Shapes window, containing various sets of elements with shapes, each of which is represented by a gray header with the name of the set; - working area occupied by the page of the document; - page controls; - status bar, which includes various indicators, buttons and controls. The buttons and indicators on the left side of the status bar are context sensitive, so they will show different information depending on the state of the document. The status bar also contains document scaling tools. 6
Figure 7 Title bar Quick Access Toolbar Program window title Tabbed ribbon Shapes window Workspace (document window) Status bar Backstage view Page controls 1 Zoom tools When you start Visio, it opens in what is known as Backstage view. Backstage view contains many of the items that were previously on the File menu, and Backstage view's blue tab is called File (Figure 2). The Backstage view is the central place for managing files and related data: creating, saving, opening, printing, and setting options that control the operation of the Visio program. When you start the Visio program, a window (Figure 2) opens, prompting you to select a template for the created document. 7
8 Fig. 2 A template in Visio is a set of elements with which diagrams are created. Visio contains a huge number of shapes grouped according to various criteria. It is not easy to choose the right ones from such a list, therefore, templates are used that contain only the components necessary for a particular task. The Recently Used Templates section contains templates that are frequently used in your work. The Template Categories section contains groups of templates that are grouped by topic. The Business template group combines diagrams that describe various business processes, graphs, and charts. The Flowchart group also contains templates that are mainly responsible for business processes. The Maps and floor plans category includes, in addition to what is explicitly stated in the title, site plans, power supply schemes, engineering communications, alarm systems, etc. The most primitive general schemes, if only simple geometric shapes are needed for work. 8
9 Use the Programs and Databases group diagrams to design the structure of a website, database, or software product, user interfaces, and manage data flow. In Schedules, you can find the Timeline of events, calendar and Gantt chart. The Network category includes templates for topology design local network, LDAP and Active Directory directory structures, server rack locations. Category Technique is electrical and other principal networks. When we select the template icon, an enlarged image and a description of its purpose appear in the right part of the window. A new document is created after pressing the Create button or by double-clicking on the template. Stencils can be found online by selecting Office.com Templates. Check out Sample Diagrams to see what Visio can do. The From existing document button opens a window for selecting a previously saved scheme, or you can use the Open command. Choosing a template does not limit the set of elements that can be used in the current schema. Choosing a workpiece, we only solve the problem of selecting the necessary components from a large list. If you select the File tab when a drawing is open, Visio will always display the Details page of the Backstage view. The right side of the page shows information about the open document along with the Properties list, which is used to view and set additional properties for the document. The central area of the page includes two command buttons: Delete personal data and Reduce file size as its name suggests to reduce the document size. The buttons above the Info command in the navigation bar on the left are basic file management functions that are the same in all Office applications. The Visio Options dialog box contains many options that control how the program works. nine
10 Working with the Ribbon In all Office 2010 programs, the ribbon tabs contain commands (controls: buttons, drop-down lists, checkboxes, counters, etc.). The teams are grouped (Fig. 3). In some groups, to the right of the group name, there are small group button icons. Clicking such a button opens the corresponding dialog box or task pane containing additional options associated with the group. Commands tab Command group Group icon 3 The appearance of commands on the ribbon changes as the width of the ribbon changes. The specific tabs that appear on the ribbon depend on the edition of Visio you are using. In addition, the Visio edition also determines which buttons are enabled and which are disabled. The following permanent tabs appear on the ribbon: File. Selecting the colored File tab displays the Microsoft Office Backstage view. Home. Here are the commands that are most often used in the work. Related commands are organized into the following groups: Clipboard, Font, Paragraph, Service, Shape, Arrange and Edit. Insert. The tab contains the following groups: Pages, Illustrations, Scheme Parts, Links, Text. Constructor. Here you can change Page Setup, select Themes, create or modify Watermarks, Page Layout. Data. The commands of this tab allow you to create and maintain links with External data, Display data using pictures, 10
11 datasets, and in the Show/Hide group, you can display the Shape Data Window or the External Data Window. Process. (This tab is only available in the Premium edition). In the Subprocess group, you can create a new subprocess or link to an existing one. The commands in the Schema Validation group allow you to validate a schema against a set of business rules and manage validation questions. This tab also allows you to import or export a SharePoint Workflow. Reviewing. Here are the groups of commands Spelling, Language, Notes, Corrections and Reports. View. The commands on this tab determine what will be displayed on the screen. The Full Screen button in the Modes group puts the Visio application in full screen display mode. The Show group lets you select which document window aids are visible: Ruler, Grid, Guides, Page Breaks, and Task Panes. The commands in the Scale group allow you to change the scale of a document. The Visual Aids command group enables or disables various visual cues. The buttons in the Window group allow you to arrange windows or navigate through the windows of open Visio drawings. The Macros group provides the ability to create macros in Visio and access additional add-ins. In addition, you can display another permanent Developer tab for creating macros using the built-in VBA (Visual Basic for Applications) programming language. There are two other types of tabs in Visio that only appear when needed. These are contextual tabs and add-on tabs. Contextual tab sets contain infrequently used functions and are displayed only when an object is selected or the cursor is placed on it. A set of contextual tabs includes a colored header and one or more tabs below it. For example, the Picture Tools contextual tab. This contextual tab is displayed when a drawing is inserted or selected in a Visio drawing page. Under the green heading Artwork, there is one 11
12 on the Format tab, which includes commands for cropping, rotating and other options for changing the picture (Fig. 4). Rice. 4 Add-in tabs link to software that enhances the Visio program. Some add-ons are made by Microsoft and shipped with Visio, others are sold by third parties software. Unlike contextual tabs, add-in tabs look like the permanent Visio tabs, but with one fundamental difference: they only appear when the add-in is active. For example, the Organization Chart add-in is included in the standard distribution of the Visio program and is activated when a diagram is created or edited using any of the organization chart templates (Fig. 5). Rice. 5 When you move the mouse pointer over the buttons and controls on the ribbon tabs, tooltips appear (Figure 6). Rice. 6 12
13 Tape can be rolled up. You can collapse/expand the ribbon by doing one of the following: Click the Collapse Ribbon (Expand Ribbon) button located in the upper right corner next to the help button; click right click mouse anywhere on the ribbon and select the Collapse Ribbon command from the context menu; double-click the name of the active tab; press the key combination Ctrl + F1. The Shapes window The Shapes window is used to organize shapes and search for additional shapes. Shapes are stored in stencils. Each diagram template includes one or more sets of elements with shapes for a given type of diagram (Fig. 7). Rice. 7 The Shapes window can be hidden or shown using ribbon commands. On the View tab, in the Show group, click the Task Panes button and choose Shapes. New area The Quick Shapes at the top of each stencil (above the thin dividing line) are designed to house the shapes you use most often. To add shapes to or remove shapes from this area, simply drag them to the desired location. Not only can you reorder shapes in the Quick Shapes area, you can also reorder them anywhere in the stencil by simply dragging the shape. 13
14 If multiple stencils are open, but only a few shapes are used from each stencil, click the Quick Shapes tab to display Quick Shapes from all open stencils in one place. The stencils are arranged sequentially in the Shapes window. Shapes from only one stencil are displayed at a time. To display shapes from a specific stencil, click the stencil header. Stencil titles always appear at the top of the Shapes window, but when using multiple stencils, you can hide their titles to make room for the shapes. When the stencil titles are hidden, a scroll bar is displayed next to the titles. To display all headings, the headings area can be expanded by dragging down the border between headings and shapes (Figure 8). Rice. 8 When you click on the title bar of any set of items, the remaining title bars remain in place, and the contents of the set always open in the same place below them. This is the advantage of Visio 2010 over previous versions of the program. To close any of the stencils, right-click on its header and select Close from the menu that opens. The width of the Shapes window can be changed by dragging the right border of the window to the left or right (Fig. 9). Minimize the Shapes Window button introduced in Visio If you need to free up screen space, you can minimize the Shapes Window by clicking the small arrow in the upper right corner (Figure 9). fourteen
15 In the minimized window, you can still drag shapes, change stencils, view additional stencils by clicking the Stencil icon at the top of the window. Minimize Shapes Window button Pointer for resizing the window. 9 To maximize the window, click the Expand Shapes Window arrow at the top of the window (Figure 10). Button Maximize Shapes Window Button Set of Elements 10 You can customize the display of shapes in stencils. Icons and names are used by default, shapes are arranged in two columns. To change the display of figures in the Shapes window, right-click on the header of a set of elements and select the View command in the menu that opens (Fig. 11). 15
16 Fig. 11 Any stencil can be opened in any diagram, even non-template-based diagrams that include stencils by default. You can view all available templates in the Shapes window. In the Shapes window, click the More Shapes heading. A menu will open with categories similar to template categories. Select a category, view the stencils included in it, and select one of them to use in the diagram (Figure 12). Rice. 12 By default, the Find Shapes box is hidden to make room for shapes. To open the Find Shapes field to search for shapes directly instead of browsing stencils: 16
17 1. In the Shapes window, click the More Shapes button. 2. Select Find Shapes. 3. In the upper part of the Shapes window, the Search for shapes field will appear (Fig. 13), enter the name of the shape in this field or keyword. Rice. 13 If the desired element is not in local sets, you must either reformulate the query or search the Internet using the Find Shapes Online command (Fig. 13). To hide the search form, uncheck the box next to the item of the same name in the Additional Shapes menu. Document window (workspace) The workspace is the main window of the Visio program. Since this window can contain several pages of the document, the window is also called the document window. The document window is surrounded at the top and left by rulers that display inches, millimeters, or other selected units of page size. At the bottom left of the document window is a set of page controls (Fig. 14). Rice. 14 Everything here is almost the same as in Excel. Four buttons make it possible to switch to the first, previous, next and last pages, respectively. The tab displays the name of the page (by default, Page-1 and further in order), the button to the right of the tab allows you to add a new page. To set a new name, double-click on the tab and enter a new name. 17
18 Another way is to select Rename from the context menu. Directly from the context menu of the tab, you can open the Page Setup window (Fig. 15). Rice. 15 The scroll bars on the right and bottom of the workspace are responsible for moving around the sheet if the element is somewhere outside the boundaries of the displayed space, for example, when zoomed in. Status bar and zoom tools The status bar at the bottom of the Microsoft Office programs displays the status of the options that you select to display in the status bar. Many options are selected by default, but you can customize the status bar and turn options on or off. Right-clicking on the status bar opens the Status Bar Settings window (Figure 16). Clicking any command in the Status Bar Customization menu toggles the display of the button or control. Rice
19 If nothing is selected on the document page, the left edge of the status bar looks like this (Figure 17). Page number Language Macro Fig. 17 The Page Number button shows which page is active and the total number of pages in the current document; Clicking this button opens the Page dialog box (Figure 18). Rice. 18 The Language button shows the language of the active document (the language of the document is taken from the settings of the Visio program or the Windows operating system). The Macro button opens the Macro recording dialog box (Fig. 19). Rice
20 If a shape is selected on the document page, then the left edge of the status bar looks like this (Fig. 20). Number Width Height Angle Language Page macro 20 The Width and Height buttons display the dimensions of the selected shape, and the Angle button shows the angle of its rotation; clicking on any of these three buttons opens the Size and Position window (Figure 21). (Fig. 22). Rice. Fig. 21 On the right side of the status bar are other controls. Decrease Slider Increase Window List Fig. 21 22 The View Mode button in Visio does not work, a similar button in other Microsoft Office applications switches between drawing views. The Full Screen button allows you to view the document in full screen mode. Full screen mode Scale selection Fit the Panorama and View page to the current scale window The Scale selection button shows the current scale value, pressing the button opens the Scale dialog box (Fig. 23). twenty
21 Fig. 23 Scaling also occurs by pressing the plus or minus buttons, as well as by moving the scale slider The Fit page to current window button changes the scale of the page so that it fits entirely in the document window. The Pan and Zoom button opens the corresponding window (Fig. 24). Rice. 24 The Window List button allows you to switch between open windows (Fig. 25). The commands corresponding to the buttons are also on the View tab. Rice
22 WORKING WITH A VISIO DOCUMENT Creating documents There are many types of Visio diagrams, but you can use templates to create almost all documents. Visio has many diagram templates and thousands of shapes, some simple and some quite complex. Each template is designed for a specific purpose, the easiest way to get information about templates and their purpose is to use the Template Categories window. Follow these steps to create a new Visio drawing. 1. On the File tab, select the New command (Fig. 26). 2. In the Select a template section, do the following: to use one of the built-in templates, in the Template categories section, select the desired category and template, and then click the Create button; to reuse a template, select it in the Most Recently Used Templates section and click Create; to use a previously created template, under Other ways to get started, select From an existing document, navigate to desired file and click the Create New button; To find a template on Office.com, under Other ways to get started, select Office.com templates, select the template you want, and then click Download to download the template from Office.com to your computer. When the schematic template opens, most of the space will be taken up by the blank schematic page. Nearby there will be a Shapes window containing various sets of elements with shapes. Visio names the new drawing Document N, where N is a sequential number that increments by one for each new drawing created in the same Visio session. 22
23 Fig. 26 Creating a New Diagram from a Master Diagram In addition to the templates, Visio 2010 includes five ready-made master diagrams that you can use as a basis for creating your own diagrams. Each diagram includes shapes, text, and data on one or more pages. To create a new diagram from one of the reference diagrams in Visio 2010, follow these steps: 1. On the File tab, select New. 2. In the More ways to get started section, select Sample Diagrams. The panel in the center displays the names and thumbnails of five sample diagrams. The panel on the right displays information about the selected schema sample and a button called Open Sample Data (Figure 27). 3. Select the desired sample, and the program will not open a sample document, but will create a new schema based on it and name it Document1. If you are using Visio Professional or Premium edition and you see the External Data window, on the Data tab, in the Show/Hide group, clear the External Data Window check box to hide the window. If you are using Visio Standard edition, then the External Data window will not be displayed. 23
24 Fig. 27 In addition to creating a new diagram from the five samples included with Visio, version 2010 also allows you to create a new diagram from any existing diagram. This makes it possible to create a schema by starting with existing content and knowing that any changes will not affect the original schema. Opening Documents Opening Visio Documents To continue working with a previously created document, you must open the appropriate file. There are several ways to do this, the easiest of which is to double-click the left mouse button on the file icon in the Windows Explorer window. This will automatically start Microsoft Visio, and the document you specified will be opened in it for editing. If Visio is already running and ready to use, you can open an existing drawing using the Open command on the File tab. The Open button of the Open dialog box has a menu, the commands of which allow you to select the mode of working with the document (Fig. 28). You can also open recently used documents with the Recent command on the File tab. 24
25 Fig. 28 Opening other types of files in Visio . Visio allows you to open files of different formats. By default, the Open Document window only displays Visio files (*.vsd; *.vdx;*.vdw, etc.). To open a file of a different format, click on the button that indicates the type of files to be opened, and select the required format or All files mode. Visio can also open files in the *.dwg or *.dxf formats commonly used in applications such as AutoCAD. At the same time, when opening *.dwg or *dxf files in Visio, we open not just a static drawing, but a full-fledged dynamic changeable drawing. Saving Visio files By default, Visio saves files in the *.vsd format. When you save a diagram, you can select one of many other formats directly from the Save As dialog box by selecting the Save As command from the File tab. Depending on how you plan to use the schema and organize collaboration with it, different formats can be used: a regular image file, including in JPG, PNG, and BMP formats; .htm web page (image and other resource files are saved in a subfolder in the same location where the .htm file is saved); PDF or XPS file; drawing in AutoCAD DWG format or DXF. 25
26 Working with Drawing Pages A Visio drawing can have any number of pages, and each page can have its own dimensions, units of measure, and other characteristics. In addition, the page of a document on the screen may have dimensions that are different from the dimensions of the physical page of the printer. The ability to set a document page size that is different from the physical page size allows you to do the following: compress large diagrams to fit on a smaller sheet of paper; print the diagram on a very large sheet of paper; print the diagram on several sheets of paper. Visio provides a great deal of flexibility in customizing page attributes that are useful for virtually any type of diagram and any form of printed or electronic output. Visio diagrams also support two types of drawing pages. The front pages contain the active content of the schema and are usually the ones that are printed or published. Watermark pages contain elements that can be displayed on one or more pages. When you link an underlay page to a front page, all text and graphics on the underlay appear on the front page. One typical use for underlay pages is to add identical borders or headings to a set of front pages. Second inclusion of a company logo, notice, or any other graphic element or text across multiple pages. To insert a new page, on the Insert tab, in the Pages group, click the Blank Page button or use the Insert Page button on the Page Control Panel. When you add a page, Visio copies all the characteristics of the active page. Therefore, if the pages in the document have different settings, you must make the page with the desired settings active before adding a new page. 26
27 Setting Page Setup You can change page setup on the Design tab, in the Page Setup group, or in the Page Setup dialog box (Figure 29). Rice. 29 You can change the page name on the Page Properties tab of the Page Setup dialog box, but it's more convenient to simply double-click the page name tab or use the page tab's shortcut menu. Visio allows you to change not only the names of pages, but also their order in the drawing. As you drag the page title tab, the page icon appears on the pointer, and a black downward arrow points to the insertion point for the page (Figure 30). Rice. 30 You can right-click on any page tab and select Reorder Pages. And in the opened dialog box Change page order (Fig. 31) use the Up and Down buttons to set the desired page order. 27
28 Fig. 31 Pages can be deleted using the context menu for the page tab by selecting the Delete command (Fig. 32). Rice. 32 Background pages and frames Visio allows you to manually create background pages and assign them to your favorite front pages. Visio has several features that automatically create and assign background pages. On the Insert tab, in the Pages group, click the arrow on the Blank Page button, and then click For new page. The Page Properties tab of the Page Setup dialog box opens, with the Watermark radio button selected as the type, and by default the page is called Background-1. A background page can be used as an underlay to other pages in a Visio drawing. Background pages are applied on a per-page basis. If you create a new page from an active page that 28
29 includes a background page, the new page will also include that background page. On the Design tab, in the Watermarks group, click the Frames and Titles button. The Frames and Titles collection opens with thumbnails of each variation in the collection. To see the name of one or another variant, you need to move the mouse pointer over it (Fig. 33). Rice. 33 Visio creates a Visio Background-1 background page that contains title shapes and applies it to the active page. Most of the top of the page is reserved for the title of the document, while the area on the right shows the current date. The page number is also shown in the lower right corner. The page number is updated dynamically as pages are added, removed, and reordered. The automatically generated background page is called Visio Background-1. The program includes the word Visio to distinguish between automatically generated background pages and user-created background pages. Changes made on the background page are reflected on all front pages that use it. 29
30 Tabs for background pages are always displayed to the right of front page tabs and their order cannot be changed. Layers Visio lets you organize objects into layers and manage various properties of all objects on a layer at the same time. For example, you can control whether layer objects are printed, displayed on the drawing page, and whether they can be selected. On a city map, for example, you could put roads on one layer, sewers on another, water pipes on a third, and buildings on a fourth. By arranging the diagram in this way, you can lock specific layers so that when you work with shapes on other layers, you can prevent this collection of objects from being moved or selected inadvertently. Similarly, you can print a map showing only roads and buildings. Layers provide great flexibility in managing parts of a complex circuit. However, working with layers requires advance planning. A document page can have many layers, each layer can have its own properties, and any shape can be on one or more layers at the same time or not be on the layer at all. Select the shapes to place on the layer. On the Home tab, in the Editing group, click on the Layers button and select the Assign to Layer command, in the Layer dialog box that opens, click the New button to open the Create Layer dialog box (Fig. 34), in which enter a name for the layer. Rice
31 You can continue to use this dialog box to create additional layers and to add selected shapes to other existing layers. Putting shapes on a layer is not the same as putting them in a group. Unlike a group, shapes on a layer can be selected, moved, and resized individually. On the Home tab, in the Editing group, click the Layers button and choose Layer Properties. The Layer Properties dialog box (Figure 35) includes several checkboxes for setting the properties of each layer. Rice. 35 The Visible check box controls whether the layer's shapes are displayed on the drawing page. The Print check box includes or excludes layer members from printing. Since there are two flags Visible and Printing, you can create a scheme in which the objects of the layer are displayed in the document on the screen, but are not printed, and vice versa. If a layer is set to Active, any new shapes added to the page are automatically added to that layer. Several layers can be active at any given time. In this case, new shapes are added to all active layers. 31
32 The Lock checkbox prohibits selection, moving or editing of shapes on the layer. Also, shapes cannot be added to a locked layer. The Snap and Stick checkboxes allow/prohibit snapping or sticking other shapes to the shapes on this layer. The Color flag allows you to temporarily override the colors of all objects on the layer; unchecking this box returns the original colors to the layer members. Selecting the Layer Color check box in the lower right corner of the dialog box activates the Layer Color and Transparency settings. Each layer refers to only one page. When a new layer is created, it is added to the current page. If you copy the objects of the layer to another page, then the layer will also be added to it. If a layer with the same name already exists on this page, the copied shapes are added to this layer. The shapes in some Visio stencils include preassigned layers. For example, these are shapes of block diagrams and layouts of buildings. Also, dynamic connectors are always on their own layer, so dropping the first such connector to any page creates a layer called Connector. Previewing and Printing Documents On the File tab, click the Print button (Figure 36). Rice
33 If you select Quick Print, Visio 2010 will print the diagram to the default printer with standard settings. Print will open a standard print window where you can check or change the printer properties, select the range of pages to print and the number of copies (Figure 37). Rice. 37 To view the diagram before printing, select the Preview button (Fig. 38). Rice
34 By default, an entire page of the document is shown, divided into printed pages called tiles. When you hover over a tile, Visio highlights it with a red border. In the Preview window, you can configure the page settings by clicking the Page Settings button (Fig. 39). Rice. 39 Small charts can be centered on the page in the Printing Preferences dialog box by clicking the Setup button (Figure 40). Rice
35 WORKING WITH SHAPES Understanding Shapes Shapes refer to almost all template elements that can be used to build a diagram, including connectors and even the page itself. Shapes are not just icons or pictures. They have properties to help you customize schemas. Visio shapes are prefabricated objects that you drag and drop onto a drawing page. They are the building blocks of the circuit. Stencils are containers for similar shapes. As a rule, in one template there are several such sets with different types of shapes. When you drag a shape from the Shapes window onto a drawing page, the original shape remains in the set. The original figure is called a sample. The shape that is placed in the document is a copy of the so-called master shape instance. You can place as many instances of the same shape as you like in a document. Types of Shapes A Visio shape can be simple (such as a line) or complex (such as a calendar). There are two types of shapes in Visio: one-dimensional and two-dimensional (Figure 41). Rice. 41 Each type of figure behaves in a certain way. If you know the type to which a shape belongs, you can successfully perform operations on that shape. 35
36 A one-dimensional figure behaves like a line, and a two-dimensional figure behaves like a rectangle. One-Dimensional Shapes A one-dimensional shape is a shape that, when selected, has a start point and an end point (Fig. 42). One-dimensional figures usually look like line segments. Rice. 42 When you move the start point or end point, only one dimension changes: length. However, the most important behavior of one-dimensional shapes is their ability to connect two other shapes. The simplest one-dimensional figure is a line segment. When selected, it is defined by two end markers. In addition, since a line can have absolutely any shape (not necessarily a straight line), an arc can be one-dimensional, or a curve of any shape. This type of one-dimensional figures has the ability to change not only the length, but also the curvature and shape of the curves. Such figures have a central marker. A one-dimensional figure can even look like a two-dimensional one, i.e. be a rectangle, for example. In this case, belonging to one-dimensional figures will be determined precisely by the type of markers. Since the arrows were created in MS Visio to connect shapes, they are also one-dimensional, although they are closed shapes and are measured not only by length. Different one-dimensional figures may have the ability to control different parameters. For example, an arrow is multi-sided, but it has only two markers: start and end, only the distance between them can be changed here. Some arrows have handles similar to 2D shape handles that allow you to change the width of the arrow. 36
37 In addition, there are also complex one-dimensional figures, with control handles that allow you to change the shape of the plumage and arrow pointer. Thus, a clear sign of a one-dimensional figure is the presence of start markers and end markers. Formatting one-dimensional shapes is done in the same way as formatting others. The only limitation is those one-dimensional shapes that are not closed, they cannot be filled in and can only change the color of the line. But it is these figures that have the ability to change the endings. 2D Shapes A 2D shape is a shape that has no start and end points when selected. Instead, the 2D shape has eight selection handles (Figure 43). Rice. 43 2D shapes are the basic shape of MS Visio, i.e. all the rest are their consequence. For example, a cube in MS Visio is a special case of a two-dimensional figure rectangle. The essence of two-dimensional shapes is the lack of start and end markers, which means that there is no ability to connect shapes. Two-dimensional figures may not be closed. The simplest two-dimensional figure is a figure formed by joining two lines. A selected 2D shape is always framed by eight handles that can be used to control its size. If you click and drag a corner selection handle, you can change two dimensions: length and width. However, 2D shapes cannot be used to connect other shapes. This behavior is typical only for one-dimensional figures. 37
38 Two-dimensional shapes are usually used to represent something or a general idea, such as a step in a flowchart, or special facility, such as plant or equipment. Some 2D shapes are drawn to look like 3D. But despite this, in Visio, these shapes are considered two-dimensional. You can find out that the figure is two-dimensional by eight selection markers. At first glance, some shapes look like they are two-dimensional, but they are actually one-dimensional. And vice versa. To avoid confusion, select a shape and Visio will tell you what type the shape is. Shapes with Special Behavior All shapes in Visio are 1D or 2D, depending on their behavior. However, some shapes have additional behavior that is unique to them, regardless of whether they are 1D or 2D. This makes these figures especially useful. For example, some shapes have yellow control handles that allow you to interact with the shapes. Control handles are not the only indication that shapes have special interactive behavior. Some special behaviors can be detected when you right-click a shape. For example, when creating a room plan, the door can be configured, if necessary, so that it opens from one side or another (Fig. 44). Rice. 44 When working with Visio, you may need to add text, photos, or pictures. Although these objects are not shapes created for Visio, Visio still treats all of these objects as shapes. If you type text on a blank part of the page, that text will be a 2D shape, and when you select that 38
39 text, it will have eight selection markers visible. If you select the inserted picture, these handles will also be visible in it. Any object on the page is a shape for Visio. Adding a Shape to a Document When you create a diagram, you drag the shapes from the stencil onto a blank page (Figure 45) and connect them to each other. Rice. 45 Using AutoConnect when dragging shapes onto a page Drag a shape from the stencil onto the drawing page and position it near another shape. Without releasing the mouse button, move the pointer to one of the light blue triangular markers. The color of the marker will change to dark blue. Release the mouse button. The shape will be placed on the page, and the connecting line will be added and glued to both shapes (Figure 46). Rice. 46 To get the same result without dragging a shape onto the page, first select it in the stencil, then position the pointer over the shape 39
40 in the document and click one of the light blue triangular handles displayed near this shape. Adding Connected Shapes to a Page Automatically Using the AutoConnect feature, you can quickly add connected shapes to your diagram without having to go back to the Shapes window to select each shape. The selected shapes will be placed on the diagram at regular intervals and evenly aligned. When you move the mouse pointer over the shape's autoconnect arrow, a mini-toolbar appears next to the pointer (Fig. 47). Rice. 47 This toolbar displays the first four elements of the Quick Shapes area of the active stencil (or, for example, if the Simple Flowchart Shapes stencil is active, the first four elements of the group containing the selected shape), except for one-dimensional shapes. To add the desired shape to the page, click it on the mini toolbar. If you need to select a different shape, move your mouse away from the autoconnect arrow and the preview window will disappear. After that, you can drag the desired shape onto the page from the Shapes window. If the shapes you want to connect to are already on the page, draw a connector from one shape's autoconnect arrow to another shape. Change the quick shapes for a stencil. Open the stencil and drag the quick shapes in the order you want. Shapes can be dragged both into the Quick Shapes area and outside it (Fig. 48). 40
Fig. 41 Quick figures Fig. 48 Inserting and removing shapes with automatic adjustment As you add and remove shapes to and from an existing diagram, Visio connects and repositions the shapes automatically. You can insert a shape into the diagram by dragging it onto the connecting line. Nearby shapes will be automatically moved to make room for the new shape, and a new connector will be added to the sequence of shapes (Figure 49). Rice. 49 When you delete one of the shapes in the sequence, such as the middle shape in the figure above, the two connectors are automatically replaced with one between the two remaining shapes. However, in this case, the two remaining figures do not converge. If you need to align the spacing between the shapes, select them and click the Auto-align and spacing button. 41
42 Connecting Shapes Connecting Shapes Using AutoConnect Visio provides the ability to connect shapes using autoconnect to create, for example, flowcharts or organizational charts. AutoConnect was first introduced in Visio 2007 as a quick connection shapes with dynamic connectors. To use the autoconnect function: 1. Position the mouse pointer over the shape you want to connect to another shape and hold it down until the blue autoconnect arrows appear around the shape (Figure 50). 2. Click and drag the autoconnect arrow to another shape. To create a dynamic connection, release the connector at the center of the shape; to create a connection to a specific point, drag the end of the line to that point. Hovering the mouse pointer over the blue arrow opens the Quick Shape Live Preview window, but you can ignore this: the window disappears when you move the pointer to a different location. The shapes will remain connected even as you drag each shape to a new location, which is very handy when creating, for example, computer network diagrams. Rice. 50 The connecting line has three types of markers: end markers, mid-segment marker and corner marker, with which you can change its position and shape (Fig. 51). 42
LECTURE-1. INTRODUCTION PURPOSE, COMPOSITION AND MAIN ELEMENTS OF THE INTERFACE OF APPLIED SOFTWARE FOR PROCESSING BUSINESS INFORMATION Questions: 1. The concept of software and its classification
Tambov Regional State Budgetary Educational Institution of Secondary Vocational Education "Instrument-Making College" Word processor interface Microsoft Word 2007 Concept
Word basics Word is a powerful text editor and document layout application, but to use it most effectively you need to know the basics.
Quick Guide Getting Started The interface of Microsoft PowerPoint 2013 has changed from previous versions, and we've created this guide to help you get up to speed faster. Finding the right
Quick Start Guide The interface of Microsoft Word 2013 has changed from previous versions, and to help you get up and running quickly, we've created this guide. Customize your panel
INTUIT.ru::Internet University of Information Technologies 1/18 O.V. Spiridonov Lecture 2. Working with files The lecture is devoted to working with files in Microsoft Word 2010. New Microsoft file formats are presented
Chapter 6 Page Design and Sizing, Working with Layers
Http://testprof.msk.ru Microsoft Excel 2007 Tutorial page 1 General information
OpenOffice.org Impress Impress is an OpenOffice.org program for working with slide shows (presentations). You can create slides that contain many different elements, including text, bulleted
Lecture 8 AutoCorrect The menu command [File Options Spelling AutoCorrect Options] allows you to automatically insert frequently used text and graphic objects into a document, as well as automatically
Working with tables 1. Converting text into a table. a) Insert delimiters, such as a comma or tab, where the text should be split into columns. Use a paragraph mark to indicate
Quick Start Guide The interface of Microsoft Excel 2013 has changed from previous versions, and to help you get up and running quickly, we've created this guide. Add commands
Chapter 3 Editing Basics When you enter text into a document, it usually doesn't finish right away. In other words, after entering the text is usually edited. This chapter focuses on various aspects
Practice 3 Creating a form A form is a database object that can be used to enter, modify, or display data from a table or query. Forms can be used to manage
Brief instructions for working with Microsoft PowerPoint Action Flow How to start? Starting the program 1. On the taskbar, click the Start button. 2. In the menu that opens, click the Programs command.
Basics of working in MS Word 2007 Description of the program window After starting the MS Word program, its window opens on the screen. The title of the window contains the name open file or Document1, Document2 if
Formatting Text with Styles Have you ever used the same set of formatting options, such as color, size, or a specific font, to make text stand out? This
BBK 32.973.23-018ya7 UDC 004.42(075) B67 B67 Volkov V. B. Clear tutorial Excel 2010. St. Petersburg: Peter, 2010. 256 p.: ill. ISBN 978-5-49807-771-0 Microsoft Excel is one of the most mysterious and interesting programs
2009 CSoft Development Standard Component Library Manager. All rights reserved Contents Standard Component Library Manager...2 Security Notice...4 Starting the Library Manager
Purpose of the program Automation of all types of actions with texts. Functions creation, editing, formatting, saving, processing and printing. Word 2007 professional text editor,
Laboratory work 8 "Technology of work in the Explorer program" The purpose of the work: to study the methods of working with the Explorer program 1. Brief theoretical information As part of the Windows XP operating system, there is
Lab 7 Topic: Style formatting documents. Creating a table of contents. Using Styles In the process of creating a document, you often have to deal with headings. Usually the headings
ESSELTE EASY PRINT Program Reference CONTENTS 1. System requirements 3 1.1 Internet browser 3 1.2 Acrobat Reader 3 2. Registration, login and my account 4 2.1 Why register?
Acquaintance with Micrsft Excel 1. Structure of the table 1. The spreadsheet consists of cells at the intersection of rows and columns. Rows are numbered, columns - with Latin letters. Each cell
SMART Ink Windows Operating Systems User Guide Product Registration After registering your SMART product, we will communicate new features and software updates. Register
FEDERAL STATE EDUCATIONAL BUDGETARY INSTITUTION OF HIGHER PROFESSIONAL EDUCATION Financial University under the Government of the Russian Federation TRAINING CENTER FOR INFORMATION TECHNOLOGIES
MS Access. Forms Lectures on the discipline "Fundamentals of Programming and Information Technologies" read at the Department of FMEG of the FT Faculty of NTU "KhPI" 1 Forms There are three ways to enter information in Access:
Table of contents. 1 WORD EDITOR...2 TOOLBARS...2 HELP...2 TEXT BASICS...2 INSERT TEXT...2 DELETE TEXT...2 HIGHLIGHT TEXT...2 REPLACE SELECTED TEXT
Ministry of Education and Science of the Russian Federation Federal State Budgetary Educational Institution of Higher Professional Education "Pacific State University"
Basic features of TurboCAD In this section, we will talk about the main TurboCAD tools that are related to 2D and 3D drafting. An important role in the TurboCAD program is played by various
INTERWRITE WORKSPACE SOFTWARE MANUAL Features for Windows, Mac OS X and Linux Contents Chapter 1: Starting Interwrite Workspace...3 Chapter 2: Description
Working with Standard Document Templates User Guide for Cognitive Technologies Moscow, 2015 2 ABSTRACT This document provides information about the use in the E1 Euphrates software package
VERTICAL-Reports Technological Documentation Generation System User's Guide The information contained in this document is subject to change without prior notice. No part
SMART Ink Windows operating systems User manual Trademark notices for SMART Ink, SMART Notebook, SMART Meetin Pro, Bridit, smarttech, the SMART logo and slogans for all products
90 Chapter 5 Inscription This tab is available for objects in which text has been typed. With it, you can adjust the internal margins and specify whether the size of the object will change if the text does not fit.
Chapter 3 Microsoft Office 2013 In this chapter, we'll take a look at how some of the applications included with Microsoft Office 2013 work.
Acquaintance Variegated ribbon MICROSOFT POWERPOINT APPEARANCE. TAPE BrGU them. A.S. Pushkin BENEFITS OF THE RIBBON The most popular commands have more space on the ribbon BENEFITS OF THE RIBBON Related Commands
Microsoft Word Working with graphics Lecturer St. teacher Kupo A.N. Graphical capabilities of MS Word Microsoft Word provides quite a lot of opportunities for working with graphics. Availability of graphic objects
2.4.2. Printing a document Before you can print tables, you must set page options using the Page Layout tab. Page Setup Sets the orientation and size of a sheet of paper, scale
Chapter 8 Creating and Using Forms As noted in Chapters 1 and 2 of this book, database objects such as forms are primarily designed to work with only one record at a time.
Laboratory work 1. Basics of working with the operating system of the Windows family. General Windows feature Any operating system (OS) of the Windows family provides multitasking and multithreading
Chapter Three Working with Text 3.1 You can write and print text on a computer. To print text on paper, you need a special printer device. Special
Basic tasks in Word 2010 Understanding Word application Microsoft Word 2010 is a word processor designed to create professional-looking documents. Bringing together the best means
Narrative Qlik Sense 1.1 QlikTech International AB 1993-2015. All rights reserved. QlikTech International AB 1993-2015. All rights reserved. Qlik, QlikTech, Qlik Sense, QlikView, Sense and the Qlik logo
PRACTICAL WORK 5 TOPIC: Comprehensive use of MS Word features to create large documents WORK PURPOSE: To learn how to comprehensively use MS Word features to create large documents
Topic 8 Styles A style is a set of formatting options that has a name. Styles are used: - for the professional design of the document; - to quickly change the parameters of the text; - for uniformity
Introduction to the workspace Welcome to CorelDRAW, graphics program to create vector graphics and graphic design for professionals. In this tutorial, you will learn the terminology
Stages of database development As a rule, non-professionals work with databases, so the following database requirements can be formulated. Developers, when creating a database, should be guided by these
Do you want to quickly prepare visual demonstration material for your presentation? You have a plan for the oral presentation of the material, but so far there are no concise theses, diagrams, diagrams, drawings that should sharpen
Spiridonov O.V. Microsoft Office 2007 for the user Part I From the author Working on a computer is unthinkable without creating text and spreadsheet documents. Most often, for these purposes, a package of office
2010-2011 Work in MS Office 2007, Office 2010 Creating Power Point presentations Quick reference overview of the capabilities of the Power-Point presentation program based on materials from office.microsoft.com/ru
Registering and reviewing changes to a document Document creation often involves multiple users. If the authors and reviewers of the policy brief or project proposal are
Tambov Regional State Budgetary Educational Institution of Secondary Vocational Education "Instrument-Making College" Lecture materials on the topic "Text Microsoft editor
Catalogue: SCS User Manual The information contained in this document is subject to change without notice. No part of this document may be reproduced or
Features of the BP 3.0 interface Introduction Configuration "1C Accounting 8" ed. 3.0 is based on the previous edition of the program, but has undergone many internal and external changes, among which the most notable
Tip 1: Excel Version Differences 29 Tip 1: Excel Version Differences If you are reading this book, you must already be using Excel 2010. Microsoft package Office 2010, released in 2010. I found,
Scroll bars 3 LAB 1 HELP AND STARTING WINDOWS PROGRAMS. Tasks: Turn on the computer and boot the operating Windows system. On the surface of the desktop, find the panel
Microsoft Visio provides the ability to quickly create business graphics of varying degrees of complexity: business process diagrams, technical, engineering drawings, presentations, various options for organizational, marketing and technical diagrams of electrical and electronic circuits, transport communications systems, etc. The main idea embodied in Microsoft Visio - to create the possibility of effective use in individual projects of ready-made professional developments, presented in the form of a rich built-in collection of Visio libraries, in which the entire arsenal of elements is divided into thematic categories and arranged into stencils. Thus, the task of creating the necessary graphics comes down to choosing the necessary stencil and dragging the desired shape onto the document page. Color themes, backgrounds, and titles are then easily added to the created objects to produce professional-looking documents. What makes Visio especially attractive is the ability to develop your own libraries (Stensils) with graphic shapes (Master).
As a leader in the creation of a variety of business documents, Visio can also be used as a CAD system, design tool or as a regular vector editor Visio is a great tool to make the visualization of experimental and scientific data and statistical information as efficient as possible.
Getting started with the program
Find the Microsoft Office folder on the Desktop, and in it the icon of the Visio 2010 editor and double-click on it. This will open the start window of the editor (Fig. 3.1).
Rice. 3.1. Editor start window
In this window, the user is given the opportunity to select ready-made library templates. After selection Template Categories Flowchart, and then, Simple block diagram the Visio working window will appear, with which you can create a document and work with it (Fig. 3.2).

Rice. 3.2. Editor window for creating flowcharts
The document has a book structure. A new sheet is entered into the document in the same way as in Excel. You can change the name of the sheet if necessary. Each sheet can have its own, different formatting options. You can use the group tools to configure page settings Page settings tabs Constructor or set the required parameters in the dialog box Page settings(Fig. 9.3).
Basic elements of the Visio user interface
The Visio interface is traditional for Windows applications; many elements are integral parts of any Windows application: title bar, quick access toolbar, ribbon with tools, working field, scroll bars, status bar, etc. (Fig. 3.2)
Visio-specific elements are: stencils - panels figures with ready-made professional developments for the selected category of elements, located on the left side of the Visio workspace.
Working with Visio drawings - opening, saving documents, importing and exporting images, as well as ways to manage multi-page files are performed by standard Windows techniques and are carried out using the Home tab.
Microsoft Office Visio 2007 is a universal data and application modeling tool that supports both the creation of data models and object-oriented application modeling.
Applications and new features of the business graphics package Microsoft Visio 2007.
For those who have not dealt with the Microsoft Visio package, its purpose is from short description functions, probably, will not seem very clear. Indeed, the wording itself "the program provides graphical representation, analysis and communication of complex data, systems and processes" says little, since there are a lot of products that solve such problems. It does not clarify the situation too much that among the most popular areas of application of Visio are business process management, business data analysis, project management, IT and network management, etc. Why do we need such a universal tool - after all, in each of these areas there are special tools with powerful graphics, data integration tools, modeling ... But at the same time, surprisingly, in all these areas, Visio is very often mentioned by analysts as one of the most popular products. This is evidenced by data from Microsoft, according to which the number of users of Visio grew from 4 million to almost 20 million from 2000 to 2007 (of which about 25% are IT professionals).
Eight years ago, when Visio entered the Microsoft arsenal, it was already very popular in its business graphics software category. A year later, the corporation first introduced a package under its own brand - Microsoft Visio 2000. From the very beginning, Visio was included in the Microsoft Office family, although all this time it stood apart and was sold only standalone, not included in office suites. Probably, this explains the fact that until recently the Russian branch of Microsoft Visio was practically not engaged in the promotion of Microsoft Visio, and for many of its potential users in our country this product remains almost unknown.
But now the situation seems to have changed: at the beginning of autumn, a solid section dedicated to the Visio product appeared on the Microsoft Russian website, then a seminar for partners and customers was held in Moscow, where experts who arrived from Redmond demonstrated the main features of the new version of Visio 2007 and outlined the possibilities for cooperation with third firms in promoting it. So it makes sense to return to this very interesting and promising package, talking about the innovations in its latest version.
Applications for Visio
In fact, the best way to understand the positioning and capabilities of Visio is to use an analogy with Excel. After all, spreadsheets are also inferior in their capabilities to sophisticated business intelligence tools, solving accounting problems in an enterprise, or performing mathematical calculations. But at the same time, for a huge range of mass tasks, Excel is not only suitable in terms of functionality, but also much more convenient because of its simplicity and accessibility.
Developing the analogy with spreadsheets, we can say that if Excel is focused on working with tabular numerical data, then Visio is designed to visualize heterogeneous information structures with various relationships. The user can apply both manual and automatic methods of drawing according to some initial data (for example, according to a tabular description of the staff of an organization or according to a description of the topology of a hierarchical system of a computer network). But in any case, it receives images in some given style or standard. Visio includes a rich set of templates - business process flowcharts, network diagrams, workflow diagrams, database models, and software diagrams - that you can use to visualize and streamline business processes, track project work and resource usage, optimize systems, organizational charting, network maps and building plans. However, Visio functions go far beyond just visualizing data: the professional edition of the package includes modeling and visual design tools for solving a number of common IT tasks, including software systems development.
We said above that Visio can be successfully applied in areas where there are already specialized tools. More detailed descriptions of some of the cases in which this package can be useful are given in the table.
One of the innovations of the Visio 2007 package is that now with its help you can not only visually represent various objects, but also manage the data associated with them, including those stored in electronic Excel tables, Access databases, and SharePoint Server lists. You can also track data trends and flag exceptions in PivotCharts, and use the new AutoConnect feature to link shapes in charts. The diagrams themselves can be saved as PDF or Microsoft XPS, or attached to email messages (the recipient can view them in Outlook 2007 even if they don't have Visio 2007 installed on their computer).
The package itself is available in two versions: Standard and Professional. The first gives users the ability to create business-themed diagrams - flowcharts, organization charts, project schedules, block diagrams, simple network diagrams, and maps. The second includes templates for more schemas, as well as some additional features.
Key Features
Visualization of complex information
Visio supports an extensive set of templates - business process flowcharts, network diagrams, workflow diagrams, database models, and software diagrams. They can be used to visualize and streamline business processes, track project progress and resource utilization, optimize systems, chart organizational structures, map networks, and build plans.
Templates let you get started quickly. Office Visio 2007 includes a number of tools that help IT and business professionals create a variety of diagrams to suit their needs. New templates in the Professional edition, such as the ITIL template or the Value Stream Diagram, expand the range of diagrams available. With standard Microsoft SmartShapes symbols and powerful search features, you can quickly find the right shape, wherever it is.
Frequently used templates have quick access. In the new Getting Started window, you can find the template you need by browsing through categories of simplified templates and large sample templates. You can access your most recently used templates in the new Recent Templates view in the Getting Started window.
When you get started with sample diagrams in Office Visio Professional 2007, it's easy to find new samples by opening the new Getting Started window and using the Samples category. Sample data-integrated diagrams can give professionals ideas for creating their own diagrams, understand how data provides context for different types of diagrams, and choose which template to use.
The new AutoConnect feature in Office Visio 2007, connecting shapes without drawing connectors, lets you connect shapes, space them evenly, and align them with a single click. When you move connected shapes, they stay connected, and connectors automatically change the path between shapes.
Identification of trends and problems
Diagrams in Office Visio Professional 2007 are smarter with the ability to link them to data to give you a more complete picture of a process, project, or system. Visual inspection of information allows you to identify important trends, problem areas or exceptions and take appropriate action. Analyzing business data with the ability to drill down and create different views provides deep insight.
From Visio to Microsoft Visio
Visio Corporation was established in 1990 and quickly became known in the IT market thanks to the eponymous software product. The success of the Visio package was largely ensured by the correct forecasting of demand for visual support tools for the daily work of administrative and technical employees and a clear positioning for a certain range of tasks: a description of the structure of the organization and the engineering and computing systems used in it, analysis of the functioning of systems, effective planning and development management. All this was reinforced high quality product, combined with moderate prices and hardware requirements.
In addition to representative user functionality, Visio's strength was that the product was implemented as a set of ActiveX objects and included a built-in Microsoft Visual Basic for Applications (VBA) programming environment. This made it possible, on the one hand, to expand the functionality of the package, and on the other hand, to easily integrate it with external applications. Actually, the success of Visio in the market was largely due to the fact that many independent software developers used it for their own purposes and promoted it on the market.
Here we need to remember that just at the end of the 90s, Microsoft began to widely promote VBA, not only as a built-in component of its office applications, but also as a universal programming mechanism for creating application solutions by third parties. The Visio package was the most prominent example of this collaboration. Moreover, in terms of the breadth and level of application of VBA, Visio was noticeably ahead of Microsoft office products of that time.
One way or another, but a product of this class was clearly not enough in the Microsoft Office family, and the corporation solved this problem by purchasing Visio in the fall of 1999. The deal was valued at about $1.3 billion (a very substantial amount at the time), which was the total market value of the Visio shares acquired in exchange for Microsoft shares. The success of the acquisition was immediately confirmed on Wall Street: on the day of the announcement of the transaction, the price of Visio shares rose by 20% at once, Microsoft shares - by 1%. The following year, Visio 5.0 was replaced by Microsoft Visio 2000, the first co-branded product.
Connecting data to charts and binding data to shapes is fairly straightforward. The new data linking feature in Office Visio Professional 2007 automatically connects diagrams to one or more data sources, such as Microsoft spreadsheets Office Excel 2007 or Access 2007 databases. Intuitive new data-binding methods for shapes save time populating data values for each shape property (also known as shape data). For example, the new autolink wizard lets you link all the chart shapes to data rows from connected data sources.
The new Data Linked Pictures feature provides many data formatting options that can be used to create attractive appearances for data related to shapes. With one click, you can display data fields as callouts next to a shape, place fields in squares below a shape, or place them directly above or next to a shape.
The new Data Refresh feature in Office Visio Professional 2007 automatically refreshes all data in diagrams, so you no longer need to do it manually. If data conflicts occur, they are easily resolved using the Update Conflicts task pane.
Using pivot charts, you can analyze business data in a graphical form instead of the usual static text and tables. To better assess problems, you can create different views of the same data.
Office Visio 2007 is an essential tool for visualizing complex data in projects. The program allows you to create reports directly from Microsoft Office Project and SharePoint Server that track tasks, owners, roles and positions on projects, as well as create a graphical display of complex project ownership structures. Reports are automatically updated when project data changes.
Diagrams for a general audience
Diagrams created with Visio make the presentation of information much more visual than just words and numbers. Professionally designed Visio diagrams are available even to users who do not have this package installed. Improved features in Office Visio 2007 increase the efficiency of communication, diversify the way they communicate, and allow you to expand your audience (Figure 6).
To design professional diagrams, Office Visio 2007 provides a new Theme feature that allows you to set colors and effects (text, lines, fill, shadow, and connector format) for an entire diagram with one click. Visio 2007 uses the same color palette as other Office programs 2007, so you can create professional looking Visio diagrams that blend in with other documents and presentations. 3D workflow shapes, designed around the new Theme feature, let you create dynamic workflows.
Saving Visio diagrams as PDF or XPS* makes them more portable and allows them to reach a wider audience. Visio diagrams can be viewed as message attachments in Outlook 2007.
Visio diagrams are imported into other Microsoft Office applications, such as PowerPoint presentations or Word documents. The presentation of business and production information in the form of Visio diagrams and image files will allow you to understand the essence of complex business processes at a glance when you get acquainted with it.
For collaborative work, the package includes a markup feature so that multiple developers can work on the same Visio diagram. This feature is commonly used when reviewing a diagram to improve the interaction of reviewers. At the same time, each of the reviewers making changes to the source file, including the person making the final decision on the changes, sees the corrections made by other reviewers. Working in Microsoft Windows SharePoint, it's easy to pull diagrams directly from Office Visio and check them back in.
To make charts accessible to everyone in your organization, you can convert them to other formats, such as saving them as Web pages with navigation controls, shape data viewer, reports, different formats images and style sheet options. If you then place the charts on your organization's intranet or extranet, anyone can see them on Windows Internet Explorer using Visio Viewer**.
Visio's shared workspace features support interoperability with Microsoft Windows SharePoint Services. Visio diagrams saved in Windows SharePoint Services sites can be opened directly in Office Visio 2007, and can be retrieved and checked back in. When a diagram is opened from a Windows SharePoint Services site, Office Visio 2007 opens the Shared Workspace task pane, which contains all workspace data, including other files, contributors, tasks, and relationships.
Customizing and Extending Office Visio 2007
Office Visio 2007 can be programmatically extended and integrated with other applications to meet specific industry use cases. To do this, you either develop your own solutions and shapes that connect to data, or use products from Visio solution providers.
Planning, analysis and visual representation of applied solutions. Office Visio Professional 2007 diagrams, such as the templates in the Programs and Databases category, help you visualize custom solutions such as Universal Modeling Language (UML), data flow, or Microsoft Windows user interface diagrams.
Development of custom applications. The Software Development Kit (SDK) helps new and experienced Visio developers create programs based on Office Visio 2007. The SDK provides a rich set of samples, tools, and documentation to help you develop custom applications more efficiently. In addition, the Visio SDK provides generic functions, classes, and procedures for the most common design tasks in Office Visio 2007 and supports many programming languages, including Microsoft Visual Basic, Visual Basic .NET, Microsoft Visual C++, and Visual C# .NET.
Integrate Visio diagramming capabilities. With Office Visio 2007 and the Visio Drawing Control, you can create custom solutions that make it easy to connect to data and display it in any context. The Visio Drawing control allows developers to embed and program the Visio drawing environment in a custom application. This opens up new possibilities for integrating solutions and leveraging the power of Office Visio 2007 in any intelligent client application. Because the Visio Drawing control can be integrated into the user interface of applications, developers can use the Visio drawing tools as a seamless part of their application without having to develop their own drawing tools.
Microsoft Visio has several advantages over other graphic designers. It is available in two bundles: Office Visio Professional and Office Visio Standard. For drawing electrical circuits, it is enough to use Visio Standard, which is half the price of Visio Professional.
For drawing electrical circuits, the main positive characteristics of Visio are:
· A convenient system for creating diagrams by dragging ready-made UGO stencils from the stencil window onto the drawing worksheet. At the same time, all stencils are in front of your eyes, convenient switching between libraries is provided, all actions are clear and minimized. There is a tool "Stamp" to display the same type of stencils.;
· Disabled "Snap" tools (to the grid, markers, vertices, connection points), the binding force of which can be smoothly adjusted, increase the accuracy of the installation of circuit elements and connectors at high speed drawing;
· Thoughtful work with the help of "hot" keys allows you to exclude additional operations when copying, duplicating elements and sections of circuits;
· To create additional UGO stencils, no additional applications are required (for most of the programs I have assigned to the second category, you need to purchase an additional application for creating stencils). The created UGO stencil, or a fragment of the scheme, can be quickly saved for later use by dragging it onto the shape library window.
When working with document scale tools and page sizes, it is impossible to find functions that would not suit or be missing.
Print settings allow you to print a document to scale and print large format documents on an A4 printer.
The following document formats are supported:
AutoCAD drawing format (DWG, DXF)
Compressed Enhanced Metafile (EMZ)
· Enhanced Metafile (EMF)
GIF Format (GIF)
・JPEG format (JPG)
Format PNG (PNG)
Compressed scalable vector drawing (SVG, SVGZ)
TIFF format (TIF, TIFF)
· bitmap Windows (BMP, DIB)
Windows Metafile (WMF)
The main disadvantage (for drawing diagrams) of Visio is the absence in its composition of a full-fledged library of conditional graphic symbols for elements of electrical circuits. A meager set of stencils for electrical elements, the included Visio does not comply with GOST.
To eliminate this shortcoming, it is necessary to create a library of GOST Electro for Visio graphic symbols, the stencils of which comply with Russian standards and are much better in terms of ease of use and functionality than those included in the program. (This library, together with a video course on drawing electrical circuits in Visio, is part of the kit for drawing electrical circuits).
Disadvantages such as autonumbering and automatic creation specifications, for me are not meaningful. Perhaps automatic specification generation is useful for designers.
The general functionality of the graphical designer, which does not depend on various object models, is implemented in the form of a single such template. To set up drawing objects from a specific type library, use the file object visualization XML descriptions. Such a file contains information about the structure of objects and how they are displayed in the editor. This file is associated with the template and loaded with it (Figure 1). When developing a "unique" GUI for modeling based on a new object library, the programmer only needs to develop such a configuration file and its XSD_schema. Then he simply creates a new editor template by copying any existing one and changes the path in it - to the new configuration file.
Rice. 1 Scheme of interaction between the designer and applications.
During editing, visual images of objects are filled with data, links are established between objects. The user of the constructor can save the result of his work either as a Visio diagram, i.e. in a file with the vsd extension, or in object structure description XML file, which represents the developed object model (or part of it) in an XML_language specially developed for this purpose. The Vsd file can only be used to further construct the model in the editor, while the XML view can be passed to the appropriate application to change the state of the object model (Figure 1). Clearly, such an application must support the object model's XML interpretation language interpretation API. Model fragments for editing "come" from the corresponding application also in the form of similar XML_documents.
With Visio Standard's wide range of diagrams, business process diagrams, network diagrams, workflow diagrams, database models, software diagrams, and other types of diagrams, you can visually document, design, and understand the state of business processes and systems. Linking charts to data helps you see a bigger picture.
Integrating diagrams with data in Visio allows you to see a complete picture of a process or system.
The following Visio Standard features make it easy visual presentation processes, systems and complex information.
Get started quickly with templates. With Visio Standard, you can easily create diagrams using predefined SmartShapes symbols linked to powerful searches for the right shapes on your local computer and on the web. Visio provides a variety of tools for creating the diagrams needed by IT and business professionals.
Quick access to frequently used templates. The new Recent Templates view in the Getting Started window that appears when you start Visio provides access to recently used templates.
Sample diagrams as a source of new ideas. Find new sample charts in the Charts window. Getting to know them will give you ideas for creating your own diagrams and help you choose a template.
Linking shapes without having to draw connecting lines. Visio's new Shape Connecting features let you link, evenly distribute, and align shapes - all with a single click. When you move connected shapes, they stay connected and connector lines automatically change direction.
Connecting data and charts and linking data to shapes. The new Data Selection Wizard lets you automatically connect charts to one or more data sources, such as Microsoft Office Excel spreadsheets and Microsoft Office Access databases. Intuitive new binding methods that populate all shape properties (also known as shape data) with data values make it possible to reduce the time it takes to bind data to shapes. For example, the new autolink wizard ensures that all shapes in a chart are linked to datasets from connected data sources.
The new data graphics task pane allows you to choose from a variety of data formatting options and provides an attractive display of data associated with shapes. With the new data graphics task pane, you can display data fields as callouts next to a shape with a single click, place fields in frames below a shape, or place data fields on top or on the side of a shape.
The new Visio Standard data refresh feature does everything for you. It automatically updates all the data in the charts without you having to do it manually. The conflict resolution task pane makes it easy to resolve data conflicts.
With Visio Standard, you can visually explore complex information to identify key trends, exceptions, and more. What's more, Visio lets you analyze, deploy, and create multiple views of your business data to better understand the information. Icon and markup libraries help you quickly spot top issues, track trends, and flag exceptions so you can quickly identify key issues and take effective action.
The following Visio Standard features enable you to analyze complex business information.
Visual representation of business data. PivotChart views provide a visual way to explore business data that is typically displayed as static text or in tables. To better understand the problem, use different views of the same data.
Detect issues, track trends, and flag exceptions. The program allows you to quickly select important points, trends and exceptions and display project progress. The new data graphics task pane makes it easy to conditionally format data with expressive and intuitive shapes, such as check marks and data bars, that display based on user-defined conditions.
Visio is an indispensable tool for visualizing complex project information. You can create reports directly in Microsoft Office Project and Microsoft Office SharePoint Server to help you keep track of tasks, responsible persons, roles, and responsibilities for a project, as well as depict complex structures of responsibility for completing project tasks. These reports are automatically updated when project details change.
Diagrams created in Visio Standard provide a far greater impact on your audience than just words and numbers. Professionally designed Visio diagrams can be shared even with users who do not have Visio software.
The following Visio Standard features help you better present information and make it available to a wider audience.
Simplified Visio diagram categories help you find the right template faster. New templates such as Windows Workflow Services help you create a wider range of charts. Volumetric workflow figures make it possible to develop more dynamic workflow processes.
The new Visio Theme, Colors and Theme, and Effects task panes make it easier to choose colors and effects for an entire diagram. Visio uses the same colors as in Microsoft program Office PowerPoint, which makes it possible to use the same colors in Visio diagrams and Office PowerPoint presentations.
Visio diagrams can be saved as PDF to enhance portability and make them available to an even wider audience. Visio diagrams attached to email messages can be viewed in Microsoft Office Outlook.
Charts can be saved as web pages with navigation controls, shape data viewer, reports, image format options, and style sheets. Any user who has installed the Visio Diagram Viewer for Internet Explorer can then view these diagrams in Microsoft Internet Explorer.
The shared workspace supports interaction with Microsoft Windows SharePoint Services. Visio diagrams saved in a Windows SharePoint Services workspace can be opened directly in Visio. When a diagram is opened from a Windows SharePoint Services workspace, Visio Standard opens the Shared Workspace task pane, which contains all workspace data, including other files, members, tasks, and links.
Insert handwritten notes. Integrated ink support in Visio lets you naturally create and annotate existing images with a pen on your tablet. Pen input and more support high resolution on a tablet computer provides the versatility of the created solutions.
Collaborate with a single Visio diagram. The markup tracking feature allows multiple users to work on the same Visio diagram at the same time. This feature is used when reviewing a diagram to ensure better interaction between its reviewers. At the same time, each of the reviewers making changes to the source file is aware of the changes made by other reviewers.
Microsoft Visio is an integral part of the Microsoft Office suite. The main purpose of Visio is, as the name of this program suggests, data visualization or, more simply, the production of almost any diagrams, illustrations and diagrams necessary for business documentation.
Using Visio, you can easily and quickly draw up a flowchart of an algorithm, depict the structure of your organization or, for example, the sequence of operations of a certain technological process. At the same time, it is not at all necessary for us to have drawing skills - the program is equipped with a large number of ready-made elements or “shapes” suitable for use in a wide variety of situations. By placing elements on a sheet, connecting them with lines indicating relationships between objects or the course of actions, and providing explanatory inscriptions, you will get an illustration that can be printed and used as a standalone document or placed as a drawing in a document prepared in another program.
The power of Visio is not limited to standard tasks such as drawing simple graphs or flowcharts. Using this program, you can display the progress of the project, prepare a building plan or, for example, a web page layout, as well as the interface of an application being developed and our company. The content of the illustrations depends only on your imagination. At the same time, you will be able to flexibly customize the appearance of the elements, which will allow you not only to use the functional coloring of parts of the illustration, but also to get a neat and attractive document.
In the process of working with Visio drawings, you can use both sets of standard graphic objects and data prepared in other applications. You can also place photographs and text fragments in the document. If you work with computer-aided design systems (for example, AutoCAD), then you can place fragments of your drawings in a Visio document or, conversely, place an illustration prepared in Visio in a drawing. In some cases, information stored in files on a hard drive or in databases may be used in illustrations.
A feature of Visio is the simple and efficient work with large format documents. Thanks to this, you can prepare a small drawing for a text report, an A4 diagram or an A1 poster. If necessary, a large-format document can be automatically divided into several smaller fragments (for example, sheets of A1 format). This will allow you to print large posters using a standard home or office printer. If you have a wide-format printer (plotter), you can print documents on larger sheets.
As we have already said, Visio is an integral part, therefore, if you have some experience with Microsoft Word or Excel, it will not be difficult to master Visio - most of the buttons, commands and tools will be familiar to you. It also doesn't take long to learn the Visio-specific ways of working with illustration elements. Thus, Microsoft Visio is an easy-to-use and at the same time powerful tool that allows you to create complex and at the same time neat schemes, diagrams and illustrations for various documents.
06.04.2013