Simulation modeling of computer networks .
The concept and goals of modeling
The efficiency of building and using corporate information systems has become an extremely urgent task, especially in the context of insufficient funding for information technology in enterprises.
The criteria for evaluating the effectiveness can be a reduction in the cost of implementing an information system, compliance with current and future requirements, the possibility and cost of further development and transition to new technologies.
The basis of an information system is a computer system, which includes such components as a cable network and active network equipment, computer and peripheral equipment, data storage equipment (libraries), system software (operating systems, database management systems), special software (monitoring systems and network management) and, in some cases, application software.
The most common approach to the design of information systems at present is the use of expert judgment. In accordance with this approach, specialists in the field of computing facilities, active network equipment and cable networks, based on their experience and expert assessments, design a computer system that provides a solution to a specific problem or class of problems. This approach allows minimizing costs at the design stage, quickly assessing the cost of implementing an information system. However, the decisions obtained using expert assessments are subjective, the requirements for hardware and software are also subjective, as is the assessment of the guarantees of the operability and development of the proposed system project.
As an alternative, an approach can be used that involves the development of a model and simulation (imitation of work - simulation) of the behavior of a computer system.
Defect-free design of computing systems
You can talk about "defect-free" design of information systems. It is achieved by complex application of high-level modeling (modeling of functions or business processes) of an enterprise and low-level modeling of a computer system. The general conditional scheme of defect-free design of an information system is shown in fig. 1.
The use of high-level modeling makes it possible to guarantee the completeness and correctness of the performance of the functions defined by the customer by the information system. That is, the constructed model is impeccable in functionality (the system must perform what is intended). However, high-level modeling cannot guarantee that a specific implementation of a computing system in an enterprise will perform these functions.
High-level modeling systems include systems such as ARIS, Rational Rose. With their help, the principles of structural analysis are implemented, when an enterprise is presented as a complex system consisting of different components that have various kinds of relationships with each other. These tools allow you to define and reflect in the models the main components of the enterprise, the ongoing processes, the information used, as well as to present the relationship between these components.
The created models represent a documented body of knowledge about the IS of an enterprise - about its organizational structure, interactions between the enterprise and other market entities, the composition and structure of documents, sequences of process steps, job descriptions of departments and their employees.
Simulation of computer system functions directly today is not possible. This task is not fully solvable. However, it is possible to simulate the operation of the system in dynamics (dynamic simulation), while its results make it possible to judge the functioning of the entire system by indirect indicators.
So, we cannot check the correct functioning of the database server and software, however, by detecting delays on the server, unserved requests, etc., we can conclude that it is working.
Thus, the systems under consideration are intended not for the functional modeling of computing systems (this, unfortunately, is impossible), but for their dynamic modeling.
Simulation of a computing system makes it possible to make a more accurate calculation of the required performance of individual components and the entire system as a whole, including system and application software, in comparison with expert estimates. taking into account the specifics of the use of this equipment in a particular institution.
Modeling is based on models of equipment and processes (technologies, software) used in the operation of the object of interest. When modeling on a computer, real processes in the object being examined are reproduced, special cases are investigated, real and hypothetical critical situations are reproduced. The main advantage of modeling is the ability to conduct various experiments with the object under study without resorting to physical implementation, which makes it possible to predict and prevent a large number of unexpected situations during operation that could lead to unjustified costs, and possibly damage to equipment.
In the case of modeling computer systems, such an object is an information system that determines the methods for obtaining, storing, processing and using various corporate and external information.
During the simulation, the following is possible:
Determining the minimum necessary, but providing the needs of transmission, processing and storage of information equipment (even having no real analogues) at the present time;
assessment of the necessary stock of equipment productivity, providing a possible increase in production needs in the near future (one to two years);
selection of several options for equipment, taking into account current needs, development prospects based on the criterion of equipment cost;
Checking the operation of a computer system composed of the recommended equipment.
Using Simulation to Optimize Network Performance
Protocol analyzers are indispensable for the study of real networks, but they do not allow you to obtain quantitative performance estimates for networks that do not yet exist, which are at the design stage. In these cases, designers can use modeling tools to develop models that recreate the information processes that take place in networks.
Methods of analytical, simulation and natural modeling
Modeling is a powerful method of scientific knowledge, in which the object under study is replaced by a simpler object called a model. The main varieties of the modeling process can be considered its two types - mathematical and physical modeling. In physical (natural) modeling, the system under study is replaced by another material system corresponding to it, which reproduces the properties of the system under study with the preservation of their physical nature. An example of this type of modeling is a pilot network, which explores the fundamental possibility of building a network based on certain computers, communication devices, operating systems and applications.
The possibilities of physical modeling are quite limited. It allows solving individual problems by specifying a small number of combinations of the studied parameters of the system. Indeed, when simulating a computer network in full, it is almost impossible to check its operation for variants using various types of communication devices - routers, switches, etc. Testing in practice about a dozen different types of routers is associated not only with great effort and time, but also with considerable material costs.
But even in those cases when network optimization does not change the types of devices and operating systems, but only their parameters, it is almost impossible to conduct real-time experiments for a huge number of various combinations of these parameters in the foreseeable future. Even a simple change in the maximum packet size in any protocol requires reconfiguring the operating system in hundreds of computers on the network, which requires a lot of work from the network administrator.
Therefore, when optimizing networks, in many cases it is preferable to use mathematical modeling. A mathematical model is a set of relationships (formulas, equations, inequalities, logical conditions) that determine the process of changing the state of the system depending on its parameters, input signals, initial conditions and time.
A special class of mathematical models are simulation models. Such models are a computer program that, step by step, reproduces the events that occur in a real system. With regard to computer networks, their simulation models reproduce the processes of generating messages by applications, splitting messages into packets and frames of certain protocols, delays associated with the processing of messages, packets and frames within the operating system, the process of obtaining access by a computer to a shared network environment, the process of processing incoming packets by a router etc. When simulating a network, it is not necessary to purchase expensive equipment - its work is simulated by programs that accurately reproduce all the main features and parameters of such equipment.
The advantage of simulation models is the ability to replace the process of changing events in the system under study in real time with an accelerated process of changing events at the pace of the program. As a result, in a few minutes, you can reproduce the operation of the network for several days, which makes it possible to evaluate the performance of the network in a wide range of variable parameters.
The result of the simulation model is statistical data collected during the monitoring of ongoing events on the most important characteristics of the network: response times, utilization rates of channels and nodes, probability of packet loss, etc.
There are special simulation languages that facilitate the process of creating a software model compared to using universal programming languages. Examples of simulation languages are languages such as SIMULA, GPSS, SIMDIS.
There are also simulation modeling systems that focus on a narrow class of systems under study and allow you to build models without programming. Similar systems for computer networks are discussed below.
Models of queuing theory
The link layer protocols currently used in local networks use media access methods based on its sharing by several nodes due to time division. In this case, as in all cases of resource sharing with a random flow of requests, queues can occur. To describe this process, queuing theory models are usually used.
The mechanism of Ethernet protocol medium partitioning is described in a simplified way by the simplest model of the M/M/1 type - a single-channel model with a Poisson flow of requests and an exponential law of service time distribution. It describes well the process of handling random incoming requests for service by systems with one server with a random service time and a buffer for storing incoming requests for the time while the server is busy executing another request (Figure 4.1). The Ethernet transmission medium is represented in this model by the service device, and the packets correspond to requests.
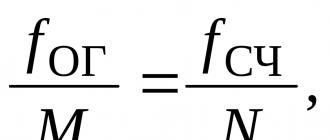
Let's introduce the notation: l is the intensity of requests arriving, in this case it is the average number of packets claiming to be transmitted in the medium per unit of time, b is the average time of servicing a request (without taking into account the service waiting time), that is, the average time of packet transmission in the medium, taking into account pauses between packets of 9.6 µs, r is the service device load factor, in this case it is the medium utilization factor, r = lb.
In the theory of queuing for this model, the following results are obtained: the average waiting time for an application in the queue (waiting time for a packet to access the medium) W is equal to:
![]()

Rice. 4.1. Applying the M/M/1 Queuing Theory Model to Analyze Traffic in an Ethernet Network
Specialized systems for simulation modeling of computer networks
There are special software systems focused on modeling computer networks in which the process of creating a model is simplified. Such software systems themselves generate a network model based on the initial data on its topology and protocols used, on the intensity of request flows between network computers, the length of communication lines, on the types of equipment and applications used. Simulation software systems can be highly specialized and versatile enough to simulate networks of various types. The quality of simulation results largely depends on the accuracy of the initial network data transferred to the simulation system.
Network modeling software systems are a tool that can be useful to any corporate network administrator, especially when designing a new network or making fundamental changes to an existing one. Products in this category allow you to check the consequences of implementing certain solutions even before paying for the purchased equipment. Of course, most of these software packages are quite expensive, but the possible savings can also be quite tangible.
Network simulation programs use in their work information about the spatial location of the network, the number of nodes, the configuration of links, the data transfer rates, the protocols used and the type of equipment, as well as the applications running on the network.
Typically, a simulation model is not built from scratch. There are ready-made simulation models of the main elements of networks: the most common types of routers, communication channels, access methods, protocols, etc. These models of individual network elements are created on the basis of various data: test results of real devices, analysis of their operation principles, analytical ratios. As a result, a library of typical network elements is created, which can be configured using the parameters provided in advance in the models.
Simulation modeling systems usually also include a set of tools for preparing initial data on the network under study - preliminary processing of data on the network topology and measured traffic. These tools can be useful if the network being modeled is a variant of an existing network and you can measure the traffic and other parameters needed for the simulation. In addition, the system is equipped with tools for statistical processing of the obtained simulation results.
There are quite a lot of systems for dynamic simulation of a computing system, they are being developed in different countries. It was possible to find such systems produced in Romania and other countries that are not leaders in the computer information industry. In addition, often developed systems for diagnosing an installed computer system (intelligent cable testers, scanners, protocol analyzers) are also classified as simulation systems, which is not true. We classify systems according to two related criteria: price and functionality. As you might expect, the functionality of simulation systems is strongly related to their price. An analysis of the systems offered on the market shows that dynamic modeling of computing systems is a very expensive business. If you want to get a real picture in a computer system - pay money. All dynamic simulation systems can be divided into two price categories:
Cheap (hundreds and thousands of dollars).
High-end (tens of thousands of dollars, in the full version - one hundred or more thousand dollars).
Unfortunately, it was not possible to find systems of the middle price range, however, many of them are a set of packages and the spread in the price of the same system is determined by the delivery set, i.e., the volume of functions performed. Cheap systems differ from expensive ones in how much detail they can describe the characteristics of individual parts of the system being modeled. They provide only "estimated" results, do not provide statistical characteristics and do not provide the possibility of a detailed analysis of the system. High-end class systems make it possible to collect comprehensive statistics on each of the network components when transmitting data over communication channels and to carry out a statistical evaluation of the results obtained. According to the functionality of the modeling systems used in the study of computing systems, they can be divided into two main classes:
Systems modeling individual elements (components) of the system.
Systems simulating the entire computing system.
The following table lists the characteristics of several popular simulation systems of various classes - from simple programs designed for installation on a personal computer to powerful systems that include libraries of most communication devices on the market and allow you to automate the study of the network under study to a large extent.
|
Company and product |
Cost (USD) |
Required resources |
Notes |
|
|
american hytech, Prophesy |
1495 |
8 MBOP, 6 MBdisk, DOS, Windows, OS/2 |
Evaluation of performance when working with text and graphic data for individual segments and the network as a whole |
|
|
CACI Product, COMNET III |
34500-39500 |
LS, GS |
32 MBOP, 100 MBdisk , Windows, Windows NT, OS/2, Unix |
Models X.25, ATM, Frame Relay, LAN-WAN, SNA, DECnet, OSPF, RIP protocols. CSMA/CD access and token access, FDDI, etc. Embedded library of 3COM, Cisco, DEC, HP, Wellfleat, ... |
|
Make System, NetMakerXA |
6995-14995 |
LS, GS |
128 MBOP, 2000 MBdisk, AIX, Sun OS, Sun Solaris |
Checking network topology data; import of real-time traffic information |
|
Net Magic System, StressMagik |
2995 |
2 MBOP, 8 MB disk, Windows |
Support for standard performance measurement tests; simulation of peak load on the file server |
|
|
Network Analysis Center, MIND |
9400-70000 |
8 MbOP, 65 Mbdisk, DOS, Windows |
Design tool, network optimization, contains data on the cost of typical configurations with the ability to accurately evaluate performance |
|
|
AutoNet/Designer |
25000 |
Determination of the optimal location of the concentrator in the HS, the ability to assess cost savings due to tariff reduction, change of service provider and equipment upgrades; comparison of communication options through the nearest and optimal access point, as well as through the bridge and the local telephone network |
||
|
Network Design and Analysis Group, AutoNet/MeshNET |
30000 |
8 MbOP, 40 Mbdisk, Windows, OS/2 |
Bandwidth modeling and cost optimization for WAN organization by simulating damaged lines, support for AT & T, Sprint, WiTel, Bell tariff scale |
|
|
Network Design and Analysis Group, AutoNet/Performance-1 |
4000 |
8 MbOP, 1 Mbdisk, Windows, OS/2 |
Modeling the performance of hierarchical networks by analyzing sensitivity to latency, response time, and bottlenecks in the network structure |
|
|
Network Design and Analysis Group, AutoNet/Performance-3 |
6000 |
8 MbOP, 3 Mbdisk, Windows, OS/2 |
Modeling the performance of multiprotocol associations of local and wide area networks; estimation of delays in queues, prediction of response time, as well as bottlenecks in the network structure; accounting for real traffic data coming from network analyzers |
|
|
System & Networks, BONES |
20000-40000 |
LS, GS |
32 MbOP, 80 Mbdisk, Sun OS, Sun Solaris, HP-UX |
Analysis of the impact of client-server applications and new technologies on network performance |
|
MIL3, Opnet |
16000-40000 |
16 MBOP, 100 MBdisk , DEC AXP, Sun OS, Sun Solaris, HP-UX |
It has a library of various network devices, supports animation, generates a network map, simulates bandwidth. |
The most popular simulation systems
BONES(Systems and Networks) is a general-purpose graphical modeling system for analyzing the architecture of systems, networks, and protocols. Describes models at the transport layer and at the application layer. Enables analysis of the impact of client-server applications and new technologies on the network.
netmaker(OPNET Technologies) - topology design, planning and analysis tools for wide class networks. Consists of various modules for calculation, analysis, design, visualization, planning and analysis of results.
Optimal Performance(Compuware; Optimal Networks) - has the ability to quickly evaluate and accurate simulation, helps to optimize distributed software.
Prophecy(Abstraction Software) is a simple system for modeling local and global networks. Allows you to estimate the computer's response time to a request, the number of "hits" on the WWW server, the number of workstations to service active equipment, the network performance margin in case of a breakdown of certain equipment.
CANE family(ImageNet Company) -- computer system design and reengineering, evaluation of various options, "what if" scenarios. Modeling at various levels of the OSI model. An advanced library of devices that includes physical, electrical, thermal and other characteristics of objects. You can create your own libraries.
COMNET family(Compuware; CACI Products Company) is an object-oriented system for modeling local and global networks. Allows you to model the levels: applications, transport, network, channel. It uses all currently known technologies and protocols, as well as client-server systems. Easily tuned to the model of equipment and technologies. Ability to import and export topology and network traffic data. Modeling of hierarchical networks, multiprotocol local and global networks; accounting for routing algorithms.
OPNET family(OPNET Technologies) is a tool for designing and modeling local and global networks, computer systems, applications and distributed systems. Ability to import and export topology and network traffic data. Analyze the impact of client-server applications and new technologies on network performance. Modeling of hierarchical networks, multiprotocol local and global networks; accounting for routing algorithms. Object-oriented approach. Comprehensive library of protocols and objects. Includes the following products: Netbiz (computer system design and optimization), Modeler (modeling and performance analysis of networks, computer systems, applications and distributed systems), ITGuru (performance evaluation of communication networks and distributed systems).
stressmagic(by NetMagic Systems) -- support for standard performance measurement tests; simulation of peak load on the file server and print server. It is possible to simulate the interaction of various users with the file server. Includes 87 performance tests.
Table 1. Simulation systems
|
Company |
Product |
Cost, USD |
Network type |
Operating system |
|
Systems and Networks |
Bones |
20000 - 40000 |
Sun Solaris, SunOS, HP/UX |
|
|
ImageNet( http://www.imagenet-cane.com/) |
CANE |
7900 - 25000 |
LAN, WAN, client-server architectures |
Windows NT |
|
Optimal Networks (Compuware) (http://www.optimal.com/) |
Optimal Performance |
5000 - 30000 |
LAN, WAN |
Windows 98/NTs |
|
Abstraction Software ( http://www.abstraction.com/) |
Prophesy |
LAN, WAN |
Windows 98/NT, OS/2 |
|
|
Network Analysis Center ( http://www.nacmind.com/, http://www.salestar.com/) |
WinMIND |
9500 - 41000 |
Windows 98/NT |
|
|
CACI Products (Compuware) ( http://www.caciasl.com/, http://www.compuware.com/) |
COMNET family |
19000 - 60000 |
LAN, WAN client-server architectures |
Windows 98/NT, OS/2, AT&T Unix, IBM AIX, DEC Ultrix, Sun Solaris, Sun OS, HP/UX |
|
OPNET Technologies (MIL3) ( http://www.mil3.com/, http://www.opnet.com/) |
OPNET family |
16000 - 40000 |
LAN, WAN, client-server architectures |
DEC AXP, Sun Solaris, Sun OS, HP/UX, Silicon Graphics IRIX, IBM AIX, Windows |
|
NetMagic Systems ( http://www.netmagicinc.com/) |
StressMagic |
3000 for 1 file server |
Windows 98/NT |
More detailed information about these systems and their characteristics are given in Table. 1. Among the most powerful and interesting are COMNET III from CACI Products Company (the system was sold to Compuware in 2000) and OPNET from OPNET Technologies (formerly called MIL3).
COMNET simulation system from CACIProducts
CACIProducts is one of the market leaders in network simulation systems, developing such tools for 35 years.
The COMNET simulation system allows you to analyze the operation of complex networks based on almost all modern network technologies and including both local and global links.
The COMNET system consists of several main parts, working both independently and in combination:
- COMNETBaseliner is a package designed to collect initial data on network operation necessary for modeling.
- COMNETIII, together with the AdvanceFeaturesPack, is a detailed network modeling system.
- COMNETPredictor is a system for quickly evaluating network performance.
COMNETBaseliner
The main problem in any network modeling is the problem of collecting data about the existing network. This is exactly the problem that the COMNETBaseliner package helps to solve.
This package can work with many industrial network management and monitoring systems, receiving collected data from them and processing them for use in network modeling using COMNETIII or COMNETPredictor systems.
COMNETBaseline allows you to create a variety of filters with which you can extract the information you need for modeling from imported data. With COMNETBaseline you can:
- Import information about the network topology, possibly in a hierarchical form;
- Combine information from several traffic log files that can be imported from different monitoring tools into a single traffic model;
- Provide the resulting traffic model for a preliminary cursory review;
- View a graphical representation of the inter-node communication, in which the traffic of each pair of nodes is represented by a line of a certain color.
The COMNETBaseline package can import data from the following products:
|
Topological information: |
Traffic information: |
|
Network General Expert Sniffer Network Analyzer |
|
Network General Distributed Sniffer System |
|
Frontier Software NETscout |
|
Axon Network LAN servant |
|
HP NetMetrix |
|
Wandel & Goltermann Domino Analyzer Compuware EcoNet |
|
Most RMON tools |
COMNETIII
general characteristics
The COMNETIII network simulation system accurately predicts the performance of LANs, WANs, and corporate networks. The COMNETIII system runs under Windows 95, WindowsNT and Unix.
COMNETIII offers a simple and intuitive way to construct a network model based on the use of ready-made basic blocks corresponding to well-known network devices such as computers, routers, switches, multiplexers and communication channels.
The user applies the drag-and-drop technique to a graphical representation of the simulated network of library elements:
The COMNETIII system then performs a detailed simulation of the resulting network, displaying the results dynamically as a visual animation of the resulting traffic.
Another option for setting the topology of the simulated network is to import topological information from network management and monitoring systems.
After the end of the simulation, the user has at his disposal the following network performance characteristics:
- Predicted delays between end and intermediate nodes of the network, channel throughputs, utilization rates of segments, buffers and processors.
- Traffic spikes and troughs as a function of time, not as averages.
- Sources of delays and network bottlenecks.

Rice. 4.1. Network Modeling with COMNETIII
Node types
The COMNETIII system operates with three types of nodes - processor nodes, router nodes and switches. Nodes can be ported to any type of communication link, from LAN links to satellite links. Nodes and links can be characterized by mean time between failures and mean recovery time to model network reliability.
In COMNETIII, not only the interaction of computers over a network is modeled, but also the process of sharing the processor of each computer between its applications. The operation of an application is modeled using several types of commands, including commands for processing data, sending and reading messages, reading and writing data to a file, establishing sessions, and pausing the program until messages are received. For each application, a so-called command repertoire is set.
Router nodes can simulate routers, switches, bridges, hubs, and any device that has a shared internal bus that transfers packets between ports. The bus is characterized by bandwidth and the number of independent channels. The router node also has all the characteristics of a processor node so that it can run applications that, for example, update routing tables or broadcast routing information over the network. Non-blocking switch nodes can be modeled by setting the number of independent links equal to the number of switch modules. The COMNETIII library includes a large number of descriptions of specific router models with parameters based on the results of testing in the Harvard NetworkDeviceTestLab.
The switch node models the operation of switches, as well as routers, hubs, and other devices that transmit packets from an input port to an output port with negligible delay.
Communication channels and global networks
Communication channels are modeled by specifying their type, as well as two parameters - throughput and propagation delay introduced. The unit of data transmitted over the channel is a frame. Packets during transmission over channels are segmented into frames. Each channel is characterized by: minimum and maximum frame size, frame overhead, and frame error rate.
In the COMNETIII system, all common media access methods, including ALOHA, can be simulated. CSMA/CD, TokenRing, FDDI, etc. Point-to-point links can also be used to model ISDN and SONET/SDH links.
COMNETIII includes tools for modeling global networks at the highest level of abstraction. This representation of WANs is useful when it is impossible or impractical to specify precise information about the topology of physical links and about the full traffic of the WAN. For example, it does not make sense to accurately model the operation of the Internet when investigating the transmission of traffic between two local networks connected to the Internet.
COMNETIII allows coarse modeling of FrameRelay networks, cell-switched networks (for example, ATM), packet-switched networks (for example, X.25).
When modeling global networks, the splitting of packets into frames is simulated, and each type of global service is characterized by the minimum and maximum frame sizes and overhead costs for service information.
Communication with the global network is simulated using an access channel, which has a certain propagation delay and throughput. The global network itself is characterized by a delay in the delivery of information from one access channel to another, the probability of frame loss or its forced removal from the network (in case of violation of the agreement on traffic parameters of the CIR type). These parameters depend on the degree of WAN congestion, which can be set as normal, moderate and high. It is possible to simulate virtual circuits in the network.
traffic. Each node can be connected to several different types of traffic sources.
Application Sources generate applications that are executed by nodes such as processors or routers. The node executes command after command, simulating the operation of applications on the network. Sources can generate complex non-standard applications, as well as simple ones that mainly deal with sending and receiving messages over the network.
Call sources generate requests to establish connections in circuit-switched networks (networks with switched virtual connections, ISDN, POTS).
Sources of the planned load generating data using a time-dependent schedule. In this case, the source generates data periodically, using a certain distribution of the time interval between data chunks. It is possible to simulate the dependence of the intensity of data generation on the time of day.
Sources "client-server" allow you to specify not the traffic between clients and the server, but the applications that generate this traffic. These applications work in the "client-server" model, and this type of source allows you to simulate the computational load of a computer acting as a server, that is, take into account the time it takes to perform computational operations, operations related to disk access, I / O subsystem, etc. .
Protocols
The communication protocols of the physical and link layers are taken into account in the COMNETIII system in such network elements as channels (links). The network layer protocols are reflected in the operation of the model nodes, which make decisions about the choice of the packet route in the network.
The backbone of the network and each of the subnets can operate on the basis of different and independent routing algorithms. The routing algorithms used by COMNETIII make decisions based on the calculation of the shortest path. Various variations of this principle are used, differing in the metric used and how the routing tables are updated. Static algorithms are used, in which the table is updated only once at the beginning of the simulation, and dynamic algorithms, which periodically update the tables. It is possible to simulate multipath routing, in which the balance of traffic on several alternative routes is achieved.
COMNETIII supports the following routing algorithms:
- RIP (minimum hops),
- The smallest measured delay,
- OSPF,
- IGRP,
- User defined routing tables.
The protocols that perform transport functions and the functions of delivering messages between end nodes are represented in the COMNETIII system by an extensive set of protocols: ATP, NCP, NCPBurstMode, TCP, UDP, NetBIOS, SNA. When using these protocols, the user selects them from the system's library and sets specific parameters, such as message size, window size, and so on.
Presentation of results
Graphs and reports
COMNETIII allows you to specify the form of the report on the results for each individual element of the model when modeling. To do this, in the menu item report select the desired item (submenu item network element) and set a specific report type for it (paragraph typeofreport).
The report is generated each time a particular model is run. The report is presented in standard text form, which is 80 characters wide and can be easily printed on any printer.
You can set the generation of several reports of different types for each network element.
There are other ways to get the statistical results of a model run besides reports. COMNETIII has Statistics buttons that enable statistics collection for each type of model element - nodes, channels, traffic sources, routers, switches, etc. The statistics monitor of each item can be set to collect only the basic statistics (minimum, maximum, mean, and variance) or to collect data on a time scale for plotting.
If the results of observations are saved in a file for subsequent plotting and analysis, it is also possible to build histograms and percentages. It is also possible to plot graphs during simulation.
Animation and event tracking
Before or during simulation, you can set the animation and event tracing modes using the menu itemsanimation And Trace.
Menu Options animationallow you to change the speed of modeling cycles and the speed of advancement of tokens - graphic symbols corresponding to frames and packets. In animation mode, the COMNETIII system shows the inflow of tokens into the communication channels and their exit from the channels, the current number of packets in the nodes, the number of sessions established with this node, the percentage of use, and much more.
In trace mode, you can display the process of occurrence of events in the model either to a file or to the screen. When displayed on the screen, you can switch to the step-by-step simulation mode, when the next event in the model occurs and is displayed only when you next click on the corresponding button of the graphical interface. You can set the level of events to be monitored, from high-level events related to the operation of applications to the lowest level events related to the processing of frames at the data link layer.
Statistical analysis
COMNETIII includes an integrated set of tools for statistical analysis of input data and simulation results. With their help, you can choose the appropriate probability distribution for the experimentally obtained data. Results analysis tools allow you to calculate confidence intervals, perform regression analysis, and estimate variation in estimates from multiple runs of the model.
COMNET Predictor
On May 1, 1997, a new tool from CACIProducts, COMNETPredictor, appeared on the market. COMNETPredictor is intended for those cases when it is necessary to evaluate the consequences of changes in the network, but without detailed network modeling.
COMNETPredictor works like this. Data on the operation of the existing network variant is loaded from the network management or monitoring system and an assumption is made about changing network parameters: the number of users or applications, channel bandwidth, routing algorithms, node performance, etc. COMNETPredictor then evaluates the impact of the proposed changes and presents the results in graphs and charts that show delays, usage rates, and estimated network bottlenecks.
Thanks to the original Flow Decomposition technology, analysis of even large global networks is performed in a few minutes.
COMNETPredictor complements the COMNETIII system, which can then be used to further analyze the most important network scenarios.
COMNET Predictor runs on Windows 95, Windows NT and Unix.
CACI's COMNET Predictor is a great product, and it's cheaper than NetMaker XA. True, Predictor is somewhat less developed and not so easy to install. In addition, the reports it generates are a little confusing and uninformative, and the network diagrams are too overloaded.
We tried several CD-ROM drives before we were able to read the information from the CD that was sent to us. Only one drive was able to cope with this task normally. Installation of the product was also not a success on the first try.
The basic Predictor configuration includes everything you need to build a network diagram by dragging device icons from the library. Unfortunately, there is so much information displayed on the diagram that it is very difficult to understand it. Predictor also includes tools for self-creation of devices and editing library information.
The Baseliner option allows you to import information about the network topology and traffic patterns from various popular network monitoring tools. Thanks to Baseliner, you will understand how much traffic a particular application generates. After that, you can build a model in which the volume of traffic from this application will increase by 10% per month, thus obtaining a forecast for several months in advance. For someone who learns to understand network diagrams (and this is not very easy to do), Predictor will seem like a very powerful tool that is not difficult to use. The parameters of network elements selected from the library can be fine-tuned.
You can then use assumptions about network growth by telling Predictor at what point they should be included in the model. As the calculation progresses, Predictor will inform the user if problems occur. For example, it is reported that in six months the load level of any router will reach 80%, which is the limit. Then you can introduce another router into the model and see if it solves this problem.
The user is provided with a number of reports, however, in order to extract useful information from them, you will have to work hard: many tables and graphs duplicate each other, and this makes it difficult to understand.
Undoubtedly, 29 thousand dollars. - this is not cheap, but if you remember that Predictor can work not only under Unix, but also under Windows NT and Windows 95, it becomes clear that its user can save on hardware (compare with NetMaker XA).
Construction of pilot projects of designed networks
If you do not need to have a real network to set information about the network topology, then to collect initial data on the intensity of network traffic sources, measurements on pilot networks, which are a natural model of the network being designed, may be required. These measurements can be performed by various means, including protocol analyzers.
In addition to obtaining initial data for simulation modeling, the pilot network can be used to solve independent important problems. It can provide answers to questions regarding the fundamental performance of a particular technical solution or equipment compatibility. Field experiments may require significant material costs, but they are compensated by the high reliability of the results obtained.
The pilot network should be as similar as possible to the network that is being created, to select the parameters of which the pilot network is being created. To do this, it is necessary first of all to highlight those features of the created network that can have the greatest impact on its performance and performance.
If there are doubts about the compatibility of products from different manufacturers, for example, switches that support virtual networks or other features that have not yet been standardized, then these devices should be checked for compatibility in the pilot network and in those modes that cause the most doubts.
As for the use of a pilot network to predict the throughput of a real network, here the possibilities of this type of modeling are very limited. On its own, a pilot network is unlikely to give a good estimate of the performance of a network that includes many more subnet nodes and users, since it is not clear how to extrapolate the results obtained in a small network to a network of much larger sizes.
Therefore, it is advisable to use the pilot network in this case in conjunction with a simulation model that can use samples of traffic, delays and throughput of devices obtained in the pilot network to characterize the models of parts of the real network. Then, these partial models can be combined into a complete model of the network being created, the operation of which will be simulated.
What do we get with simulation?
Using modeling when designing or reengineering a computer system, we can do the following: evaluate the throughput of the network and its components, identify bottlenecks in the structure of the computer system; compare different options for organizing a computing system; to carry out a long-term forecast of the development of a computer system; predict future network bandwidth requirements using forecast data; estimate the required number and performance of servers in the network; compare different options for upgrading the computing system; evaluate the impact on the computing system of software upgrades, the capacity of workstations or servers, changes in network protocols.
The study of the parameters of a computer system with different characteristics of individual components allows you to choose network and computing equipment based on performance, quality of service, reliability and cost. Since the cost of one port of active network equipment can vary from tens of rubles to tens of thousands depending on the equipment manufacturer, technology used, reliability, and manageability, modeling allows minimizing the cost of equipment intended for use in a computing system. Simulation becomes effective when the number of workstations is 50-100, and when there are more than 300, the total cost savings can be 30--40% of the project cost.
Financial side
Naturally, the question arises about the cost of conducting a survey of a computer system using simulation. The cost of the simulation itself with proper operation of the simulation system is low. The main part of the cost of the survey is the cost of remuneration of highly qualified specialists in the field of network technologies, computing equipment, modeling systems, conducting an object survey, compiling models of components and the computer system itself, determining the directions of development and modifications of the computer system and its models.
Inspection and modeling of a computer system of 250 nodes can last one to two weeks, while the cost can range from $5,000 to $17,500. If the cost of informatization projects for large organizations often exceeds $500,000, then the cost of modeling work is in any case less than 4% from the cost of the project.
At the same time, we get: an objective assessment of the solution and a feasibility study; guaranteed required performance and performance margin; sound and manageable decisions for phased modernization.
Simulation systems not included in the review
CPSIM(BoyanTech) is a simple system for modeling serial and parallel processes. The model is a directed graph in which nodes are objects (computers, servers, network equipment), arcs are communication channels.
NetDA/2(IBM) - designed for designing, analyzing and optimizing global networks and reengineering existing SNA networks. You can set your own routing algorithms. Allows you to simulate "what if" scenarios. It also supports the TCP/IP protocol. Implemented on OS/2.
NPAT(Network Planning and Analysis Tools); Sun, - designed to simulate integrated data/voice networks based on T1 and T3 backbones. Implemented on Solaris 2.6, 7.
SES/Workbench(HyPerfomix) -- modeling of local and global networks at the application, data link and physical levels. Modeling of complex applications, DBMS. Allows you to conduct a cost analysis of options. There is a mechanism for placing control points and tracing.
WinMIND(Network Analysis Center) - a system for designing, configuring and optimizing the network; contains cost data for typical configurations with the ability to accurately assess performance and pricing.
Family AUTONET(Network Design and Analysis) -- includes AMS monitoring and management system, allows for network performance assessment, as well as accurate modeling and billing of network solutions.
Project ns2/VINT
1996 marked the beginning of work on the VINT (Virtual InterNetwork Testbed) project, organized by DARPA (Defense Research Projects Agency) and implemented under the guidance of a number of scientific organizations and centers: USC / ISI (University of Southern California / Information Sciences Institute), Xerox PARC, LBNL (Lawrence Berkley National Laboratory) and UCB (UC Berkley). Today, the main sponsors of the project are DARPA, NSF and ACIRI (AT & T Center for Internet Research at ICSI). The main goal of the VINT project was to build a software product that allows simulation of communication networks and has a number of characteristics, including high performance, visualization of results and flexibility. The network simulator package developed at the University of California since 1989 (until 1995 known as REAL) was chosen as the basis for the software implementation. It is logical that the name network simulator 2 (hereinafter referred to as ns2) was chosen for the software product.
ns2, like its predecessors, was developed as open source software (open source code software - OSS). Such software is distributed free of charge - without any restrictions on the right to use, modify and distribute by third parties. Thus, in terms of cost, ns2 is definitely the leader in comparison with the commercial software mentioned above - it is free. For the same reason, all updates and additions (new libraries, protocols, etc.) are free and always available on-line. Another no less remarkable property of OSS software is the ability to modify the program core and flexible configuration in accordance with the requirements of a particular user. One of the distinguishing features of ns2 in terms of flexibility is multi-operation. Full versions, which include all functions, are currently running on the following operating systems:
- SunOS;
- Solaris;
- Linux;
- FreeBSD;
- Windows 95/98/ME/NT/2000.
To install the full version of ns2, you need 250 MB of free disk space on your computer and a C++ compiler. There is also a simplified version (compiled) for some operating systems, in particular all versions of Windows, which is not as flexible as the full version, in particular, it is impossible to add components, modify the kernel, etc. However, this version is very easy to use and does not require deep knowledge of the OS and C++ language. For the simplified version of ns2 to function, it is enough to have 3 MB of free space on the computer's hard disk.
The performance requirements of the ns2 computer are not so strict. In principle, a computer with a 486 processor can provide acceptable functionality even for the full version of ns2. If a group of users needs to use ns2, it is enough to have the full version installed on a machine running a Unix-like OS. Users can access ns2 in terminal mode and make the necessary modifications, including the program kernel, by compiling their version to the home directory. Animation of the obtained results is also possible with the help of the X-server.
netsimulator.
NET SIMULATORis intended for modeling networks with packet switching and various methods of packet routing.
NET SIMULATORwill allow the developer or network maintenance personnel to model the behavior of the network by changing: the network topology, the method of routing packets, the bandwidth of any network channel, the load on the network (intensity of input streams), the length of packets and the distribution of the number of packets in one message, the size of the memory at switching nodes, restrictions on the maximum time spent by messages in the network, priorities of various messages.
The system allows modeling such packet routing methods as the relief method, the Ford method, the Dijkstra method, the Baren method, the packet delay exchange method between network nodes, the Gallagher method, the Bellman equation solution method (for a special type of network), as well as random routing, RIP protocols , EGP, IGRP, BGP, OSPF, etc. Most of the methods are implemented in non-randomized and randomized modifications.
The system uses the principle of dividing messages into types that differ in the lengths and priorities of packets, the distribution of their number, the intensities of input streams, etc.
As a result of the model, information is obtained about:
- average delays (delivery times) of messages of various types;
- histograms and distribution functions of the delay (delivery time) of messages;
- histograms of densities and distribution functions of occupied memory by switching nodes;
- the number of messages of various types that have reached the addressee;
- the number of failures in the delivery of messages for various reasons (lack of memory, exceeding the allowable time spent in the network, etc.);
In the process of modeling, at the request of the user, it is possible to fill in the "network event log" for subsequent statistical analysis.
Opnet.
Opnet Modeler offers users a graphical environment for creating, executing and analyzing event simulations of communication networks. This handy software can be used for a wide range of tasks, such as typical communication protocol creation and verification, protocol interaction analysis, network optimization and planning. It is also possible to use the package to check the correctness of analytical models and describe the protocols.
Within the framework of the so-called project editor, palettes of network objects can be created, to which the user can assign various forms of connection of nodes and connections, up to those that look like a puzzle. Automated generation of network topologies - rings, stars, random networks, is also supported and backed up by utilities for imported network topologies in various formats. Random traffic can be automatically generated from algorithms specified by the user, as well as imported from the standard real line traffic formats included in the package. Simulation results can be analyzed and traffic graphs and animations will again be generated automatically. A new feature is automatic conversion to format html 4.0x.
One of the benefits of creating a network model with software is that the level of flexibility provided by the modeling engine is the same as for models written from scratch, but the object-building environment allows the user to design, improve, and produce models for reusable..
There are several editor environments - one for each type of object. The organization of objects is hierarchical, network objects (models) are connected by a set of nodes and communication objects, while node objects are connected by a set of objects, such as queue modules, processor modules, transmitters and receivers. The software version for radio channel modeling contains models of the radio transmitter antenna, receiver antenna, moving objects of the node (including satellites).
The behavior logic of the processor and queue modules is defined by the process model, which the user can create and modify within the process editor. In the process editor, the user can define the process model through a combination of the state machine algorithm ( finite - state machine - FSM ) and programming language operators C/C++.
The triggering of a process model event during the simulation is controlled by raising an interrupt, and each interrupt corresponds to an event to be handled by the process model.
The basis of communication between processes is a data structure called a package. Package formats can be specified, that is, they define which fields can contain standard data types such as integers, floating point numbers, and package pointers (this last ability allows package modeling to be encapsulated). A data structure that calls interface control information ( interface control information - ICI ) can be shared between two process model events - this is another mechanism for inter-processor communication, it is very convenient for simulation commands and conforms to the layered protocol architecture. A process can also dynamically spawn child processes, which will simplify the functional description of systems such as servers.
Several basic process models are included in the base package, simulating popular networking protocols and algorithms such as the border gateway protocol ( border gateway protocol - BGP ), transmission control protocol. Internet protocol ( TCP/IP ), frame relay ( frame relay), Ethernet , asynchronous transfer mode ( asynchronous transfer mode - ATM ), and WFQ (weighted fair queuing ). The base models are useful for the rapid development of complex simulation models for common network architectures, as well as for teaching to give an accurate functional description of the protocol to students. It is possible to accompany with comments and graphics (with support for hypertext) models of a network, node or process.
In direct dialogue mode, detailed documentation is available in the format pdf . The tutorial contains simple examples that allow you to quickly learn all the intricacies of the program. I turned on Opnet in a student lab in a networking course at the University of California, San Diego, and found that in about a week, most students acquire a basic knowledge of how to synthesize simulation models using this software product.
NetMakerXA.
The simulation engine used in Make Systems' NetMaker XA is one of the most powerful on the market, which is a big part of the product's performance. For whatever you take - everything works in full accordance with the descriptions. We had no problems either with modeling the small network we designed, or with improving the system given by the manufacturer as an example. In addition, the reports generated by the program contained all the necessary information.
The main disadvantages of NetMaker XA are the need for serious user training and high cost. If you add the cost of additional modules to the price of the basic configuration of the product, you get a fairly significant amount.
The core of the product is the Visualizer, Planner and Designer modules. Each of them performs one function; to model the operation of a network, all three are needed.
The Visualizer is used to obtain information about the network and view it. It includes auto-sensing SNMP modules that query network devices and create objects corresponding to them. Information about these objects can then be edited using the Visualizer.
Planner is a device library that helps you analyze what happens when you install a new device on your network (for example, an additional router). Make Systems provides plugins (plug-ins) containing objects with data about products from different manufacturers. Such objects contain a complete description of various device models (from the number of network interfaces to the type of processor); All information is certified by the manufacturer. Using Planner, the user can independently build their own objects to describe network devices and communication channels that are not included in the library.
Designer is needed to build network diagrams. This tool allows you to easily and quickly create models and analyze alternatives. If you use it in conjunction with Planner, you can get information about how the network of a given configuration will work.
If you want to go a little further, you will have to purchase three more modules: Accountant, Interpreter and Analyzer. The Account includes a billing database; this module helps you analyze the costs associated with the use of certain public access networks. We found the Interpreter module very useful for collecting data from traffic analysis tools. The data was then automatically imported into our model, allowing it to be used in near real time rather than hypothesizing about network performance. Finally, the Analyzer and its survivability plug-in help develop disaster recovery plans and ensure that no failure (after localization) can lead to the failure of the network as a whole.
All this wealth of functions is very expensive - from 37 thousand dollars. for the basic kit plus additional payments for built-in modules. Anyone who wants to purchase the Accountant, Interpreter and Analyzer modules will have to fork out another $30,000. NetMaker XA can only be installed on SPARCstation from Sun Microsystems.
To this must be added the cost of training, because without it you simply will not succeed. Make Systems recognizes that using their product is not easy; during the tests, a specialist was sent to us, who taught us how to work with the package.
Nevertheless, for the happy owner of a large network of several thousand nodes, NetMaker XA is what you need..
SES/Strategizer - an alternative approach
For those who don't intend to include growth in their network model, Scientific and Engineering Software's much less expensive SES/Strategizer product ($9,995) will do just fine.
SES/Strategizer calculates models very quickly. We installed this product on a Pentium II workstation, and in just 2 seconds, the program calculated how a fairly complex network would perform for 24 hours. CPU utilization by process, user, and behavior.
One of the serious shortcomings of the program is the need to restart the model every time you make any changes. Other products allow you to insert various variables into the model (for example, taking into account the growth of the network); as a result, you can try several options during one run of the program.
Installation did not cause any difficulties, although we were very surprised to receive the program on floppy disks. Like other packages, SES/Strategizer allows you to easily set and modify parameter values such as bandwidth. In addition, the product prompts for confirmation ("Apply" or "Cancel") if the user tries to close the dialog box by clicking on the cross in the upper right corner. This feature is not provided in other products, which is inconvenient because with them you can never be sure which action will be taken by default.
Still, certain aspects of the SES/Strategizer need to be improved. For example, to view simulation results on the same PC where the program itself is running, you need to run Microsoft Excel; it must take data from files created by SES / Strategizer, where tab characters are used to separate numeric fields. If Excel is not installed, the user receives a strange error message indicating a completely different reason for the failure. You just need to inform the user that he should install Excel, or provide the ability to view through some other application.
The differences between SES/Strategizer and Predictor are by no means as big as their price difference ($19,000) suggests. Predictor is good in that the calculations can cover a long period of network existence, and the user can take into account traffic growth over time. In terms of functions, SES / Strategizer is not far behind at all - the user will just have to put up with the need to constantly recalculate the model again.
Yet NetMaker XA remains king. It's for those who can shell out a hefty sum and want to get their hands on the best network simulator.
Basic requirements for simulation systems of computing systems
No need for programming; the ability to import information from existing network management systems and monitoring tools; the presence of an expandable library of objects; intuitive interface; simple adjustment to real world objects; flexible system for constructing simulation scenarios; convenient presentation of simulation results; animation of the modeling process; automatic control of the model for internal consistency.
Buyer Tips
How to choose a simulation system? Everyone chooses a system according to the tasks and allocated funds.
If you want to get acquainted with the fundamental capabilities of simulation systems, if you do not have the task of "tuning", that is, setting up an existing system, but you only want to roughly determine whether it will function when installing any additional device without constant failures , - buy a cheap product.
However, as real experience shows, sooner or later you will face the task of full-scale simulation of a computer system. And here it is necessary to remember the following.
Unfortunately, in contrast to high-level modeling systems that are sold and supported by well-known Russian companies (ARIS - Vest-Metatechnologies, Rational Rose - Argussoft, Interface, etc.), suppliers of dynamic simulation systems We have not been able to locate computer systems. In 1997-1999, some domestic companies were involved in the presentation, sale and support of the COMNET and OPNET families, but then this process was suspended. The reasons, probably, are in the specifics of the Russian market (an open reluctance to give the customer real specifications and prices for information systems and the fear of an independent examination of solutions), in the lack of funding.
Useful is the Network Buyer's Guide (www.networkbuyersguide.com), which provides a product description, manufacturer, price, and contact information.
Experience shows that attempts to contact the manufacturer directly lead to a positive result. Either the manufacturer himself will respond and supply this system, or he will name a distributor in Europe from whom this product can be purchased. We communicated with CACI Products and OPNET Technologies (formerly MIL3) and successfully obtained the necessary software.
Unfortunately, consulting companies that would be associated with network modeling are currently unknown to us in Russia.
In our country, the COPMNET III and OPNET systems are most widely used. It is these products that are distinguished by the high completeness of the library, since the companies producing them have agreements with manufacturers of network equipment. But before you buy an expensive system, determine which of the packages included in its composition you really need.
|
NetwprkWorld World Class Network Simulator Test Results |
||||
|
Index |
Weight coefficient, % |
NetMakerXA* |
COMNET Predictor |
SES/Strategizer |
|
Large device library |
10 = 2,0 |
6 = 1,2 |
5 = 1,0 |
|
|
Performance |
10 = 1,5 |
10 = 1,5 |
10 = 1,5 |
|
|
Schema Clarity |
9 = 1,35 |
5 = 0,75 |
7 = 1,05 |
|
|
Possibility to import data about |
9 = 1,35 |
8 = 1,2 |
8 = 1,2 |
|
|
Expandability |
10 = 1,0 |
7 = 0,7 |
6 = 0,6 |
|
|
Flexibility and ease of use |
8 = 1,2 |
8 = 1,2 |
7 = 1,05 |
|
|
Documentation |
7 = 0,7 |
7 = 0,7 |
5 = 0,5 |
|
|
final grade |
9,1 |
7,25 |
6,9 |
|
|
Notes.* The World Class award is given to products that score 9.0 or more. Grades were given on a 10-point scale. Weight coefficients (the relative importance of the criteria) were taken into account when calculating the final grade. |
||||
This review focuses on three high-end products. NetMaker XA from Make Systems received the World Class award. However, COMNET Predictor from CACI Products, which can be combined with a more powerful product called COMNET III, fell just short of the leader. The SES/Strategizer package, available from Scientific and Engineering Software for $9995, is recommended for those looking to save money.
Having studied a number of packages for modeling the operation of a network, we came to the conclusion that all of them can quite solve the problem that they are designed to solve. However, only those who are ready to spend a lot of money and effort will be able to achieve good results from them. Products from market leaders Make Systems and CACI Products, as well as the field's recent debut Scientific and Engineering Software (SES), have managed (albeit with varying degrees of success) to analyze testnet configuration data and provide information about the possible consequences any changes.
NetMaker XA from Make Systems was ranked #1 as the most complete and flexible product. CACI's COMNET Predictor, a recently introduced cousin to the more widely known COMNET III program, also made a good impression, but could use a better charting tool and less complex reports. SES's SES/Strategizer is relatively cheap, but unlike NetMaker XA and COMNET Predictor, it does not account for future network growth.
I must say that we expected a little more from the packages reviewed. In particular, none of the programs is able to report that the network is too complex, or suggest how to improve it to improve performance. They only indicate whether the proposed project will be workable and where you can run into problems. The administrator has to choose the best way to solve problems.
Moreover, none of the products can be considered as a completely ready-to-use tool that can accurately simulate the operation of an existing or even a newly designed network. It is necessary to spend significant funds on training before it becomes possible to build correct models and interpret the results. Then it will take another six to nine months to continuously adjust the model, and only after that it will be at least approximately brought into line with reality.
To understand why this happens, you need to remember how models are built when working with these products. All programs are equipped with graphic design tools that allow you to build network diagrams by dragging icons corresponding to various devices from the library to the program workspace. The following shows how the devices are connected by LAN and WAN links operating at different speeds, and finally, the diagram is supplemented with network activity data obtained from network monitors.
Having received all this data, the program builds a system of mathematical equations with the help of which the behavior of the network is modeled. Unfortunately, one or two errors in the initial information can ruin everything.
|
Network modeling tools: advantages and disadvantages |
|||
|
NetMaker XAfirmsMake Systems,www.makesystems.com |
COMNET PredictorfirmsCACI Products,www.caci.com |
SES/StrategizerfirmsScientific and Engineering Software, www.ses.com |
|
|
Advantages |
Top performance |
Great opportunity to enter traffic data in real time |
Low price, ease of use |
|
Flaws |
Very high price |
Installation problems |
Delivery on diskettes |
|
Price, USD |
40,000 for a typical configuration |
29 000 |
9995 |
Issues and trends
Modeling tools are as diverse as the local networks they represent
Network management systems are usually advertised as all-encompassing and all-powerful. Network simulation tools can not be called such. The range of prices for these funds is from 129 dollars. (for a Windows-based LANModel program from the Network Performance Institute) up to $40,000. (for COMNET III by CACI, which can run under Windows 95, Windows NT and Unix).
Each of the products really has its own "environmental" niche. Some tools are designed for managing local networks, while others are designed for administrators of geographically distributed networks. Some simply allow network diagramming and have limited modeling capabilities, while others are capable of complex WAN analysis.
However, none of the tools can cover all tasks, so if you need to simulate a network and analyze its operation, you will have to buy several products. There are also notable differences between products that claim to solve the same problems.
Let's take modeling for example. While many of the products listed in the summary table include network element, device, and protocol libraries, not all products are capable of modeling the same objects. Let's say ImageNet's CANE program can simulate 9000 different devices and end stations, and Telenix's SimuNet product package contains only the Cisco router library. Of the 13 tools listed in the table, ten are capable of modeling Cisco routers and other internetworking devices such as hubs, gateways, and switches. Less than half of the programs allow taking into account the operation of communication channels of local and geographically distributed networks. One tool library, NetArchitect by Datametrics System, includes processors, disk controllers, and disks.
As for the protocols, the following should be noted. Eight products can simulate network layer protocols such as IP and IPX. Seven programs are capable of modeling link layer protocols, such as IEEE 802.3, 802.5, ATM, frame relay. The six packets take both network and link layer protocols into account. The protocol library included with the Virtual Agent package from Network Tools allows you to simulate the operation of SNMP, which is ubiquitous in LAN devices. However, it is not easy to find a tool that can work with proprietary protocols for legacy equipment and communication protocols.
It is imperative to find out which network elements can calculate the work of one or another tool. In this area, you can run into the most interesting results. Most products calculate how the elements of the network about which they have data will work. However, three packages failed: Image Net's CANE cannot simulate disks, chips, and controllers; Virtual Agent from Network Tools does not take into account the work with queues and the speed of data transfer over physical media; SimuNet from Telenix is unable to take into account, for example, device architecture. With the exception of NetArchitect from Datametrics, no tool can model the operation of the system as a whole. This means that it is not possible to take into account, for example, the influence of end station parameters. It is likely that vendors will address this issue a little later, as networks become more common and are designed to take into account the nature of the applications running on them. Directory services and network protocols on such networks will support latency-sensitive traffic.
In addition, network modeling tools have somewhat limited ability to account for the throughput impact of prioritization and service level operation on the network. Considering the importance now attached to the means of delivering and managing service levels, it becomes clear that this shortcoming must be corrected.
The advantage of all these solutions is the presence in their delivery kits of examples of models and characteristics of the network; - they help users get comfortable with the products. This can only be welcomed, since modeling and analyzing the behavior of networks is a tricky science; manufacturers and users are just beginning to comprehend it.
Modeling tools are to be expected to adapt to the changing nature of networks, which are becoming increasingly intelligent and increasingly system-driven (in particular, the nature of applications and network services provided). In the near future, we should expect the emergence of simulation and prediction tools for Gigabit Ethernet. This is especially important due to the identified problems with differential delays on multimode cable.
Another important point is voice over IP. It is clear that simulator vendors will be paying more and more attention to this problem as companies seeking to offload their long-distance telephone traffic to the Internet attempt to assess the impact of this load on their router-based networks. You can also expect the emergence of new companies that will focus their efforts on new technologies such as Gigabit Ethernet and IP telephony.
The emergence of new manufacturers of analysis tools will lead to increased competition and lower prices for products, but this will complicate the problem of choice.
Types of computer networks
Purpose of a computer network
The main purpose of computer networks is the sharing of resources and the implementation of interactive communication both within one form and beyond it. Resources are data, applications, and peripherals such as an external drive, printer, mouse, modem, or joystick. The concept of interactive communication of computers implies the exchange of messages in real time.
Printers and other peripherals
Before the advent of computer networks, each user had to have their own printer, plotter, and other peripherals. To share a printer, the only way was to sit down at a computer connected to that printer.
Networks now allow a range of users to "own" data and peripherals at the same time. If multiple users need to print a document, they can all access the network printer.
Data
Before the advent of computer networks, people exchanged information like this:
communicated information orally
wrote notes or letters (written language)
wrote information to a floppy disk, carried the floppy disk to another computer and copied data into it
Computer networks simplify this process by giving users access to almost any type of data.
Applications
Networks provide excellent conditions for the unification of applications (for example, a word processor). This means that all computers on the network are running applications of the same type and version. Using a single application will help simplify the support of the entire network. Indeed, it is easier to learn one application than to try to master four or five at once. It is also more convenient to deal with one version of the application and configure computers in the same way.
SCS - the basis of a computer local area network (LAN)
SCS - the basis of the local network
The work of the organization requires a local network that combines computers, telephones, peripheral equipment. You can do without a computer network. It is only inconvenient to exchange files using floppy disks, line up near the printer, access the Internet through one computer. The solution to these problems is provided by the technology, abbreviated as SCS.
A structured cabling system is a universal telecommunications infrastructure of a building / complex of buildings that provides the transmission of all types of signals, including voice, information, and video. SCS can be installed before users' requirements, data rate, type of network protocols become known.
SCS forms the basis of a computer network integrated with the telephone network. The set of telecommunications equipment of a building / campus, connected using a structured cabling system, is called a local area network.
SCS or computer plus telephone network
Structured cabling systems provide a long service life, combining ease of use, data transmission quality, reliability. The introduction of SCS creates the basis for increasing the efficiency of the organization, reducing operating costs, improving interaction within the company, and ensuring the quality of customer service.
A structured cabling system is built in such a way that each interface (connection point) provides access to all network resources. At the same time, two lines are sufficient at the workplace. One line is a computer line, the second is a telephone line. The lines are interchangeable. Cables connect the TP of workplaces with ports of distribution points. Distribution points are connected by trunk lines according to the "hierarchical star" topology.
SCS is an integrated system. Let's compare SCS with the outdated computer plus telephone network. A number of advantages are obvious.
integrated local network allows you to transmit different types of signals;
SCS ensures the operation of several generations of computer networks;
SCS interfaces allow you to connect any equipment of local networks and voice applications;
SCS implements a wide range of data transfer rates from 100 Kbps voice applications to 10 Gbps data applications;
administration of SCS reduces the labor costs of maintaining a local network due to ease of operation;
a computer network allows the simultaneous use of different types of network protocols;
standardization plus competition in the SCS market provide a reduction in the prices of components;
the local network allows you to realize the freedom of movement of users without changing personal data (addresses, phone numbers, passwords, access rights, classes of service);
SCS administration ensures the transparency of the computer and telephone network - all SCS interfaces are labeled and documented. The work of the organization does not depend on the employee-monopoly of telephone network connections.
Reliable durable SCS is the foundation of the local network. However, every merit has a downside. SCS standards recommend the redundancy of the quantitative parameters of the system, which entails significant one-time costs. On the other hand, you can forget about the nightmare of permanently repairing an existing office in order to build up a computer network to meet current needs.
SCS standards
The standards define the structure of SCS, operating parameters of structural elements, design principles, installation rules, measurement methods, administration rules, telecommunications grounding requirements.
SCS administration includes marking of ports, cables, panels, cabinets, other elements, as well as a system of records, supplemented by links. Together with the well-thought-out cabling, laid down at the stage of creating the SCS, the administration system allows you to maintain a good organization of the local network. The 2007 SCS standards consider the presence of administration as one of the conditions for the compliance of the SCS with the requirements of the standards.
SCS are determined by international, European and national standards. SCS standards are addressed to professional builders. In Russia, SCS is more often created by organizations specializing in computer networks and security systems.
Russia is a member of the International Organization for Standardization (ISO), therefore it is guided by international standards. This information reflects the requirements of the international standard ISO/IEC 11801.
SCS subsystems
The ISO/IEC 11801 standard divides the structured cabling system into three subsystems:
the main subsystem of the complex of buildings;
the main subsystem of the building;
horizontal subsystem.
SCS backbone subsystem and telephone network
The backbone subsystem of the building complex connects the cable systems of the buildings.
The main subsystem of the building connects the distribution points of the floors.
The backbone subsystem includes the information and speech subsystems of the SCS. The main transmission medium of the information subsystem is optical fiber (single-mode or multi-mode), supplemented by symmetrical four-pair cables. If the length of the main line does not exceed 90 meters, balanced cables of category 5 and above are used. At longer lengths, for information applications, that is, a computer network, it is required to lay a fiber optic cable.
Building trunk voice applications operate over multi-pair cables. Speech applications that create a telephone network belong to the lower classes of SCS. This allows you to increase the length of the lines of the backbone subsystem, created by multi-pair cables, up to two or three kilometers.
SCS horizontal subsystem and computer network
The horizontal SCS subsystem includes distribution panels, switching cables of floor distribution points, horizontal cables, consolidation points, telecommunication connectors. The horizontal subsystem provides a local network for subscribers and provides access to backbone resources. The transmission medium of the horizontal subsystem is balanced cables not lower than category 5. The 2007 SCS standards provide for the choice of SCS for data centers not lower than category 6. For information technology (computer plus telephone network) of private homes, new standards recommend using category 6 / 7. Transmission medium broadcast communication technologies (television, radio) of private houses / apartments - symmetrical protected cables with a frequency band of 1 GHz, plus coaxial cables up to 3 GHz. Fiber optics are also allowed.
The horizontal subsystem of the SCS is dominated by a computer network. This implies the restriction of the maximum length of the channel - 100 meters, regardless of the type of medium. To extend the service life without modifications, the horizontal SCS subsystem must provide redundancy, a reserve of parameters.
Workspace in the structure of the SCS horizontal subsystem
SCS work area - premises (part of premises) where users work with terminal (telecommunication, information, voice) equipment.
The working area does not belong to the horizontal subsystem of the SCS. A functional element of the SCS horizontal subsystem is a telecommunications connector - TP.
Workplaces are equipped with sockets that include two or more telecommunication sockets. Work area equipment is connected by subscriber cables. Subscriber / network cables are outside the SCS, but they allow you to create channels, the parameters of which are determined by the SCS standards. SCS includes patch cables / jumpers used for connections between panel ports / cross contacts.
More than 90% of SCS cables are in the horizontal subsystem. The cables of the horizontal subsystem are maximally integrated into the infrastructure of the building. Any changes in the horizontal subsystem affect the work of the organization. Therefore, the redundancy of the horizontal subsystem is so important, which ensures trouble-free long-term operation of the local network.
There are two methods for laying cables - hidden and open. For hidden laying use the design of walls, floors, ceilings. However, this is not always possible. The most common option for cable channels is plastic boxes.
Options for open laying of cable bundles include trays, boxes, mini-columns. Hidden cabling provides for the installation of built-in sockets, installation of floor hatches.
SCS distribution points - local network nodes
SCS distribution points are the ends of horizontal and trunk lines, which are fixed on panels or crosses for ease of use. To install panels, cross-countries, network equipment, floor / wall cabinets, telecommunication racks are used. A distribution point can occupy part of a cabinet, several cabinets. The premises of distribution points are called telecommunications premises, literally - telecommunications closets (Telecommunication closets). It is recommended to install one floor RP on each floor of the building. If the office floor area exceeds 1000 square meters, an additional RP is provided, connected by main channels.
SCS distribution points create local network nodes where network and server equipment is compactly located.
Floor cabinets allow you to place the end of hundreds of lines, equipment, PBX units. Telecommunication racks provide cabinet capacity but are less expensive. They are used when additional protection of LAN equipment or special operating conditions is not required. It is recommended to choose wall-mounted cabinets with a small number of lines, no telecommunications room. Cabinet equipment is cooled by fans.
Today, just like 10 years ago, there are two types of network - peer-to-peer and server-based network. Each of them has both advantages and disadvantages.
Peer-to-peer networking is likely to appeal to users who want to try the network "in the field" first, or who can only afford the low cost of building and maintaining the network. A server-based network is used where complete control over all workstations is important. It can be a small home network, or a large corporate system of networks combined into one common network.
These two different types of networks have common roots and principles of operation, which, if necessary, allows you to move from a simpler option - a peer-to-peer network - to a more complex one - a server-based network.
peer-to-peer network
Building a peer-to-peer network is very simple. The most important characteristic of such a network is that all the computers included in it work by themselves, that is, no one controls them.
In fact, a peer-to-peer network looks like a number of computers connected using one of the types of communication. It is the absence of a control computer - a server - that makes its construction cheap and quite effective. However, the peer-to-peer computers themselves must be powerful enough to handle all basic and advanced tasks (administrative, virus protection, etc.).
Any computer in such a network can be called both a worker and a server, since there is no specific dedicated computer that would exercise administrative or other control. The computer of such a network is monitored by the user (or users) who works on it. This is the main disadvantage of a peer-to-peer network - its user must not only be able to work on a computer, but also have an idea about administration. In addition, he himself has to cope with emergency situations that arise during the operation of the computer, and protect it from various troubles, from viruses to possible software and hardware problems.
As expected, a peer-to-peer network uses shared resources, files, printers, modems, etc. However, due to the lack of a control computer, each user of a shared resource must independently determine the rules and methods for its use.
You can use any operating system to work with peer-to-peer networks. Peer-to-peer networking has been implemented in Microsoft Windows since Windows 95, so no additional software is required.
Peer-to-peer networking is usually used when several (usually up to 10) computers need to be connected to the network using the simplest cable connection system and strict data protection is not needed. It is not recommended to connect more computers, since the lack of “supervisory authorities” sooner or later leads to various problems. After all, because of one uneducated or lazy user, the protection and operation of the entire network is at risk!
If you are interested in a more secure and controlled network, then create a server-based network.
Server based network
A server-based network is the most common type of network used in full-fledged home networks and offices, as well as in large enterprises.
As the name implies, this network uses one or more servers that control all jobs. As a rule, the server is characterized by high power and speed necessary to perform the tasks, whether it is working with a database or servicing other user requests. The server is optimized for fast processing of requests from users, has special software protection and control mechanisms. Sufficient server power allows you to reduce the power requirement of the client machine. The operation of a server-based network is usually supervised by a special person - a system administrator. He is responsible for regularly updating anti-virus databases, fixes problems that have arisen, adds and controls shared resources, etc.
The number of jobs in such a network can be different - from a few to hundreds or thousands of computers. In order to maintain network performance at the required level, as the number of connected users increases, additional servers are installed. This allows you to optimally distribute computing power.
Not all servers do the same job. There are specialized servers that allow you to automate or simply facilitate the performance of certain tasks.
File server. Designed mainly for storing a variety of data, from office documents to music and video. Usually, on such a server, personal folders of users are created, to which only they (or other users who have received the right to access documents in this folder) have access. Any network operating system equivalent to Windows NT 4.0 is used to manage such a server.
Print server. The main task of this server is to maintain network printers and provide access to them. Very often, in order to save money, a file server and a print server are combined into one server.
Database server. The main task of such a server is to ensure the maximum speed of searching and writing the necessary data to the database or receiving data from it with their subsequent transmission to the network user. These are the most powerful of all servers. They have maximum performance, as the comfort of all users depends on it.
Applications server. It is an intermediate server between the user and the database server. As a rule, those requests that require maximum performance are executed on it and must be transferred to the user without affecting either the database server or the user's computer. It can be either frequently requested data from the database or any program modules.
other servers. In addition to those listed above, there are other servers, such as mail, communication, gateway servers, etc.
A server-based network provides a wide range of services and capabilities that are difficult or impossible to achieve from a peer-to-peer network. In addition, a peer-to-peer network is inferior to such a network in terms of security and administration. Having a dedicated server or servers makes it easy to provide backups, which is a top priority if there is a database server on the network.
The local network
Network building concept
The simplest network consists of at least two computers connected to each other by a cable. This allows them to share the data. All networks are based on this simple principle. Although the idea of connecting computers with a cable does not seem to us particularly outstanding, at one time it was a significant achievement in the field of communications.
A network is a group of connected computers and other devices. And the concept of computers connected and sharing resources is called networking.
Networked computers can share:
data
printers
fax machines
modems
Other devices
This list is constantly updated, because. new ways of sharing resources emerge
Local Area Networks
Initially, computer networks were small and connected up to ten computers to one printer. The technology limited the size of the network, including the number of computers on the network and its physical length. For example, in the early 1980s, the most popular type of network consisted of no more than 30 computers, and its cable length did not exceed 185 m.
Network problems
Choosing a network that does not respond to a company can cause problems. The most common situation is when a peer-to-peer network is selected, although a server-based network should be installed. Network layout problems can also arise if topology restrictions prevent the network from working in some configurations.
Peer-to-peer networks
In peer-to-peer networks, or workgroups, problems can arise due to unplanned interference with the operation of the network station. Signs that the peer-to-peer network does not meet the requirements of the company are:
difficulties associated with the lack of centralized data protection
recurring situations when users turn off their computers that act as servers.
Networks with bus topology
In networks with a "bus" topology, situations are possible when - for various reasons - the bus is not connected to the terminator. And this, as you know, stops the entire network.
The cable may break
A break in the cable will cause its two ends to be free, i.e. without terminators. Electrical signals will begin to reflect and the network will stop working.
The cable may come loose from the T-connector
The computer is disconnected from the network, and the cable also has a loose end. Reflection of signals begins, therefore, the entire network stops functioning
Cable may lose terminator
If the terminator is lost, the end of the cable becomes free. Reflection of signals begins, which leads to the failure of the entire network.
Wireless network
Wireless environment
The wireless environment is gradually entering our lives. Once the technology is fully developed, manufacturers will offer a wide range of products at affordable prices, which will lead to an increase in demand for it and an increase in sales. In turn, this will cause further improvement and development of the wireless environment. The phrase "wireless" can be misleading, because it means the complete absence of wires in the network, in reality it is not. Typically, wireless components interact with a network that uses cable as a transmission medium, such a mixed-component network is called a hybrid network.
Possibilities
The idea of a wireless environment is very attractive because its components are:
Provides a temporary connection to an existing cable network.
Help organize backup to existing cable network
Guarantees a certain level of mobility
Allows you to remove the restrictions on the maximum length of the network, imposed by copper or even fiber optic cables.
Signaling
Two technologies are used to transmit coded signals over a cable - narrowband transmission and wideband transmission.
narrowband transmission
Narrowband systems transmit data as a single frequency digital signal. Signals are discrete electrical or light pulses. With this method, the entire capacity of the communication channel is used to transmit one pulse, or, in other words, the digital signal uses the entire bandwidth of the cable. Bandwidth is the difference between the maximum and minimum frequency that can be transmitted over a cable.
Broadband transmission
Broadband systems transmit data in the form of an analog signal that uses a certain range of frequencies. The signals are continuous electromagnetic or optical waves. With this method, signals are transmitted through the physical medium in one direction.
Modeling the future network is a mandatory part of any information and telecommunication network project.
The goals of modeling can be:
Determining the optimal topology;
Choice of network equipment;
Determination of network performance;
Checking the characteristics of new protocols.
On the model, you can check the impact of bursts of load, the impact of a large stream of broadcast requests, which hardly anyone can afford in a working network.
These tasks impose different requirements on programs that simulate the functioning of the network. At the same time, determining the characteristics of the network before it is put into operation is of paramount importance, since it allows you to adjust the characteristics of the local network at the design stage. The solution to this problem is possible by analytical or statistical modeling.
Analytical modeling of the network is a set of mathematical relationships that connect the input and output characteristics of the network. When deriving such relationships, one has to neglect some unimportant details or circumstances.
Simulation (statistical) modeling serves to analyze the system in order to identify critical elements of the network. This type of simulation is also used to predict the future performance of a system. The modeling process will include the formation of a model, debugging the modeling program and checking the correctness of the selected model. The last stage usually consists of comparing the calculated results with experimental data obtained for a real network.
Various modeling approaches are possible. The classic approach is to reproduce the events in the network as accurately as possible and step by step to model the consequences of these events.
Another approach could be a method where for each logical segment (collision zone) a queue of events is first modeled.
Full network modeling for operational applications involves the use of the following characteristics:
Node characteristics;
Characteristics of connections;
Protocols used;
Characteristics of the packets being sent.
Protocol characteristics:
The length of the packet sent by each node (length of the message + length of the address part + length of additional attached information);
Message length;
Time distribution of the moments of sending packets.
The description structure of each of the nodes includes:
Node number (identifier);
Node type code;
MAC address;
IP address;
Status byte (the node is transmitting; an alien packet has reached the node; ....);
Code of the protocol used (IPv4 or IPv6; TCP, UDP, ICMP, etc.);
Input/output buffer size. Buffer type (FIFO, LIFO, etc.).
Each of the existing modeling methods has its drawbacks. When building a network, it is necessary to remember what results this model should lead to.
For a more detailed analysis, it was decided to use the statistical representation of the model. The results obtained by modeling all processes in the network will be a sufficient basis for assessing the quality of the constructed network of the Lux company. This model involves modeling processes in the network using special software tools.
PacketTrecer simulator
PacketTracer is a program that is a data network emulator. Allows you to make workable network models, configure (using Cisco IOS commands) routers and switches, interact between multiple users (via the cloud). Includes a series of routers Cisco 1800, 2600, 2800 and switches 2950, 2960, 3650. In addition, there are DHCP, HTTP, TFTP, FTP servers, workstations, various modules for computers and routers, WiFi devices, various cables. The program allows you to successfully create even complex network layouts, check the topology for operability.
Completely assembled in the emulator and configured to full performance, the LAN model of the enterprise is shown in Figure 6.
Figure 6. General diagram of the information and telecommunications network.
The server room contains a database server and a web server; a router for backbone and distribution layer provision connected to an ISP; access level switches that physically unite 50 end users into a single local network, as well as a network printer and access point. User workstations are indicated schematically. Routers are connected to the Internet provider via high-speed communication lines to provide high data transfer speed. Each department of the company is defined in a separate virtual local area network, using routers, which facilitates network administration.
The network is built on a star topology. Network traffic is used to transfer data between users and file servers, as well as to transfer data to the Internet. Internet access is provided using PAT technology, at a single ip address provided by the provider.
Size: px
Start impression from page:
transcript
1 SIMULATION OF THE NETWORK IN NET-SIMULATOR Installation of NET-Simulator Compiled by: Korobetskaya A.A. NET-Simulator is a freeware program that allows you to simulate the operation of computer networks. You can download the program from the official site: The same site contains installation instructions, help and a description of an example network. For the program to work, you need to install a Java machine: To run NET-Simulator, simply unzip the archive and run the run.bat file. Attention! The path to the folder with NET-Simulator must not contain Russian characters! If everything is done correctly, the command prompt will start first, and then a window with an example network will open. In practice, more complex network simulators are used, in which many real devices are available. Simulator examples: ns-3 (free); NetSim (proprietary); HP Network Simulator (free); Cisco CCNA Labs Simulation (proprietary). 1
2 Task 1. (2 points) Read the documentation and sample network. Answer the questions. What network devices can be used in Net-Simulator? How to add and remove devices to a project? How to connect the cable to the device? How to launch a terminal to configure devices? What commands does the NET-Simulator terminal support? 2. (4 points) Implement examples of networks from the manual. point-to-point network; a network with a bus topology on a common hub; a network with a "passive star" topology using a switch; connecting networks manually through a switch; connecting different networks through a router. 3. (6 points) Implement your own network according to the option and generate a report. Describe the subnets that make up the network, according to the scheme: network address; network mask; network topology; the number of hosts on the network; the maximum allowed number of hosts; what devices are on the network; default gateway address (if any); broadcast address. Total for work: 12 points. On work, a report is drawn up in Word, which should contain answers for each item of the assignment. Work Instructions These instructions do not duplicate information from the NET-Simulator website. Read it yourself and, if necessary, refer to the program documentation! Each example is saved in a separate project. Point-to-point network Point-to-point is the simplest network consisting of 2 workstations connected by a cable. Create a new project. Place 2 computers on the sheet and connect them with a cable. When properly connected, 2 green lights will light up on the computers. 2
3 Double-click Desktop 0. A terminal window will open. Type help to see a list of available commands. The ifconfig command will allow you to view and configure the parameters of network interfaces (network cards, router connectors, etc.). 3
4 Until we set up our network, the network cards of computers are disabled and do not have their own address. To see this, enter the ifconfig command with the -a option: eth0 is the name of the interface (may be arbitrary in reality); 4
5 Link encap: Ethernet connection standard used; HWaddr physical address (MAC address), immutable; DOWN state (off); Next comes the data transfer statistics. Let's assign an IP address with a mask to the first computer (x.x/24 addresses are commonly used for small local networks): A line with IP address settings has been added to the interface description and the status has changed from DOWN to UP. Let's similarly configure the second computer to the address /24 (the address must be from the same network, for example, it won't work, but it will). Now let's check the network performance using the ping command (Ctrl + C stop the transfer, in total you need to send 7-10 test 5

6 packs). Please note that while data is being transmitted/received, green lights are blinking at the nodes, and the cable is highlighted in blue. No packets were lost during transmission. We got a workable point-to-point network. Save the result as a separate project. Security questions: What is a netmask? What is the address of the network created in the example (net id)? What are the host addresses (host ids) on the network? Hub based network. Bus Topology (Passive Star) We will continue to improve the previously created point-to-point network, but we need to keep it in a separate project. 6

7 Suppose we want to create a network of three computers. It will no longer be possible to directly connect them, because. Each computer has only one interface (network card). Even if a computer has two network cards in a real network, it is rather difficult to set up a common network without network devices; one of the computers will have to be made a server. In the example, we are implementing a simple hub-based network. It can be considered both as a "tire" and as a passive star. It is impossible to create a real bus with one common cable in Net-Simulator, because Exactly 2 devices are connected to the cable. So, add another computer, a hub (hub) to the previously created point-to-point network, and connect it with a cable, as shown in the figure (the location of the nodes on the sheet can be any): We will leave the network address the same, so the first two nodes cannot be reconfigured need to. They will still work. Tip To repeat the previous terminal command, press the up arrow on your keyboard. It is necessary to configure only the third node by giving it an address from the same network, for example: 7

8 The hub itself is not an active device and is not configurable. Check the availability of a new computer: 8

9 The first packet from the new computer was lost (perhaps network problems), then the transfer went smoothly. Please note that during data transfer, the lights on all computers flash, i.e. data is received by all devices on the network. Therefore, such a network will be very busy. Save the resulting network in a separate project. Similarly, you can add a fourth, fifth, etc. node. If the number of nodes is greater than the number of hub slots, then multiple hubs can be used, or even a separate hub for each computer to make the network look like a "bus". The network setup will be the same in all cases. And in any case, the network can be considered implemented according to the "bus" topology. Examples (does not need to be implemented). 9

10 Security questions 1. What is the network address of the hub? 2. How many nodes can there be in a network with a "bus" topology (in real and in model)? Networks using a switch. Passive Star To reduce network load, a switch can be used instead of a hub. This device can parse the physical address and transmits packets not to all nodes, but only to a specific recipient. Such a network has a "passive star" topology: the switch located in the center does not control the network, but the transmission does not go to all computers, as in the "bus", but only to the necessary ones. To do this, the switch has a table of physical addresses (mactab), which records which interface which node is connected to. 10
11 This table is filled in automatically. When trying to transmit, the switch first polls all connected devices and learns their addresses. The addresses are entered in a table, and then the switch transmits only to the desired address through the desired interface. Since devices can connect and disconnect, the MAC table is periodically cleared and the switch polls the devices again. This keeps the table up to date. To implement such a network, simply replace the hub in the previous design with a switch. You don't need to reconfigure computers. Now, if you check the health of the network, first it will be sent to all hosts, and then the switch will send data only to the desired one (from to): 11
12 Without stopping the ping, check the MAC table of the switch: Simultaneously start a transfer from the host to and check the MAC table again: 12
13 After the transfer is stopped, after a few seconds the table will be cleared. Save the resulting network in a separate project. Two networks on a common switch We can connect two different networks to the same switch as if they were separate networks. 13

14 Add two more computers to the previous project and assign /28 and /28 addresses to them. Connect the new computers to the free slots on the switch. Thus, we got two subnets: 1) with a mask, computers Desktop 0, Desktop 1, Desktop 2 14
15 2) with a mask, Desktop 4, Desktop 5 computers If we check the operation of the network, we will see that within each of the subnets, packets circulate freely, but cannot get from one subnet to another, even though these networks are connected to the same device. The reason is that the computers do not have routing tables configured, i. computers do not know how to transfer data to another network. They simply won't start transmitting to an unknown address. When we assigned ip addresses to computers, one single line was automatically added to their routing tables: with the computer's own network. You can view and configure the routing table with the route command. For computers on the first subnet, it looks like this: And on the second subnet, it looks like this: 15
16 Destination destination address, for which the route is specified in this line Gateway to which gateway to send packets, * to none, transmission within the local subnet Flags flags (automatically set): U route is active, G route uses gateway, H destination address is an address a single host, not a network Metric metric, determines the priority of routes Iface is the interface through which the transmission is carried out I.e. computers on the first subnet "know" only their local addresses from the range, and the second subnet only from the range. To connect networks together, you need to add them to the routing tables of each computer. For computers on the first subnet (Desktop 0, Desktop 1, Desktop 2): For the second subnet (Desktop 4, Desktop 5): 16
17 Tip If you make a mistake when adding a route, you must first remove the wrong route from the table, and then add the correct one: 1. Use the up arrow to scroll through the commands to the one in which you made a mistake. 2. Replace add with del and run the command. 3. Scroll through the commands again and correct the error. Now (only after configuring both subnets!) they can send packets to each other. Thus, we got two subnets connected to a common router. Save the resulting network in a separate project. Control questions: 1. Where did the second subnet mask come from? What is the maximum number of computers that can be connected to the network with this mask? 2. Does the switch have a routing table? Connecting different networks through a router If two small networks, as in the previous example, can be combined using a single switch, then for large networks that include many nodes and subnets, this option is not suitable, because: a) the physical address table of the switch becomes very large, which requires additional memory and slows down its work; b) to update the table, the switch requests the physical addresses of all network devices, and this is additional traffic; c) each computer will have to enter the addresses of all subnets into the routing table. In reality, a router (router) is used to combine networks. It distributes traffic across subnets and determines the delivery path for each packet. Then each computer does not need to know the addresses of all networks, it only needs to know the address of its router, which will already decide where to send the packet. Switches and hubs are also used in such networks, but they operate within a subnet. The traffic they generate does not go beyond the nearest router. 17
18 Open a project in which we have created a passive star network on the switch, but have not yet added a second subnet. Add a router, another hub, two computers, and the necessary cables to the project, as shown in the figure. Set the two new computers to /16 and /16. Check the health of each subnet. 18
19 Now let's configure the router. Unlike computers, the router has 8 ports, each of which has its own interface (eth0-eth7) and its own ip-address. We connected the first subnet (/24) to the eth0 interface, and the second one (/16) to the eth7 interface. These interfaces need to be given addresses from the range of the respective network, eg and Note In real networks, traditionally the router receives an address with the last byte equal to 1 (eg,) and other devices starting from 100 (eg, etc.). Stick to this rule when doing your variation. 19
20 It remains to tell the computers on the network the address of their router (include it in the routing table). We need to specify that packets for all addresses except local ones should be sent to the router. "All addresses" are entered in the table as a destination with a "default gateway" mask. Desktop 0 setup (Desktop 1 and Desktop 2 are configured in the same way): 20
21 Desktop 6 setup (Desktop 7 is configured in the same way): Checking the availability of a neighboring subnet: 21
22 In order to find out the physical address, the router uses ARP requests. During the transfer, you can view its ARP table (then it is cleared): If you start the transfer simultaneously on all network nodes: Note Real devices usually do not have a command similar to arp. It is added to Net-Simulator for clarity. The complete network settings can be viewed through the html report (see example below). Save the project in a separate file and generate a report for it. Security question What devices will need to be configured to connect another /24 subnet with three hosts to the router? 22
23 NET-SIMULATOR PROJECT REPORT Project file: Author: Description: Project created at: Report generated at: :56:6 Name: Desktop 0 Description: Desktop Interfaces: Name Status IP Address Netmask Broadcast eth0 UP Routing table: Target Netmask Gateway Metric Interface * 1 eth eth0 Name: Desktop 1 Description: Desktop Interfaces: Name Status IP Address Netmask Broadcast eth0 UP Routing table: Target Netmask Gateway Metric Interface 23
24 * 1 eth eth0 Name: Desktop 2 Description: Desktop Interfaces: Name Status IP Address Netmask Broadcast eth0 UP Routing table: Target Netmask Gateway Metric Interface * 1 eth eth0 Name: 3 Description: Name: 4 Description: Interfaces: Name Status IP Address Netmask Broadcast eth0 UP eth1 DOWN eth2 DOWN eth3 DOWN eth4 DOWN eth5 DOWN eth6 DOWN eth7 UP Routing table: Target Netmask Gateway Metric Interface * 1 eth * 1 eth7 24
25 Name: 5 Description: Name: Desktop 6 Description: Desktop Interfaces: Name Status IP Address Netmask Broadcast eth0 UP Routing table: Target Netmask Gateway Metric Interface * 1 eth eth0 Name: Desktop 7 Description: Desktop Interfaces: Name Status IP Address Netmask Broadcast eth0 UP Routing table: Target Netmask Gateway Metric Interface * 1 eth eth0 25
26 Task options Option 1. Option 2. 26
27 Option 3. Option 4. 27
28 Option 5. Option 6. 28
29 Option 7. Option 8. 29
30 Option 9. Option
31 Option 11. Option
32 Option 13. Option
33 Option 15. Option
Modeling and analysis of a local area network If two PCs need to communicate with each other, then for this they must use the same set of rules. These rules are implemented by software
FEDERAL COMMUNICATION AGENCY Federal State Budgetary Educational Institution of Higher Education "VOLGA STATE UNIVERSITY OF TELECOMMUNICATIONS AND INFORMATICS"
Topology Tasks Part 1: Accessing the Routing Table of a Host Part 2: Examining the Entries in the Routing Table of an IPv4 Host Part 3: Examining the Entries in the Routing Table of an IPv6 Host Background/Script
Lab : Using the IOS CLI with Switch MAC Address Tables Topology Addressing Table Device Interface IP Address Subnet Mask Default Gateway R1 G0/1
Laboratory work 4 Study of IP routing Purpose of work: To study the addressing rules of the network layer, learn how to distribute addresses between participants in the data network and organize routing
Working with network interfaces 1. Determine the network interfaces available on the PC. Explain the result. ip link show 2. Determine the addresses of network devices available on the PC. Explain received
Topology This document is Cisco Public Information. Page 1 of 6 Addressing Table Device Interface IP Address Subnet Mask Default Gateway PC 1 PC 2 PC 3 PC 4 PC
Topology This document is Cisco Public Information. Page Addressing Table Device Interface IP Address Subnet Mask Default Gateway R1 R2 R3 R4 G0/0 G0/0 S0/0/1
Proxy arp protocol Contents Introduction Prerequisites Requirements Components used Conventions How does an ARP proxy work? Network Diagram Advantages of ARP Proxy Disadvantages of ARP Agent
Proxy arp protocol Contents Introduction Prerequisites Requirements Components used Conventions How does the proxy arp protocol work? Network diagram Proxy arp advantages Disadvantages
Laboratory work. Creating a Switch and Router Network Topology Addressing Table Device Interface IP Address Subnet Mask Default Gateway Tasks R1 G0/0 192.168.0.1 255.255.255.0
General General information about VIPs and their configuration; Interface Redundancy in CSS 11000 Switches Contents Introduction Before You Begin Conventions Prerequisites Components Used
Practice 1: Configuring a Simple Network Objective: To become familiar with the Cisco Packet Tracer network simulator, learn how to build a simple network, configure network equipment, create VLANs and use them to
Laboratory work. Configuring Static and Default IPv4 Routes Topology Addressing Table Device Interface IP Address Subnet Mask Default Gateway R1 G0/1 192.168.0.1 255.255.255.0
General description of the work This laboratory work is intended to gain practical experience in the field of wireless local area networks (WiFi LAN). It is also suggested to get acquainted with the possibilities
1 Lab 3. Routing The task of routing is to determine the sequence of nodes for transmitting a packet from source to destination. Each router contains a table of networks connected
Topology This document is Cisco Public Information. Page Addressing Table Device Interface IP Address Subnet Mask Default Gateway Tasks R1 R2 G0/0 G0/1 S0/0/0
Packet tracer. Using the traceroute command to discover a network Topology Scenario Your company has purchased new premises for a branch office. To create the network topology you requested
Laboratory work. Troubleshooting Basic EIGRP for IPv4 and IPv6 Topology This document is Cisco Public Information. Page 1 of 12 Addressing table
Configuring network settings in MAC OS Table of contents Connection diagram WITHOUT using a home router... 1 How to check the connection... 8 Connection diagram using a home router...
Configuring a connection under Linux Ubuntu 12.04 Access type VPN Graphical mode (GUI) Ubuntu uses the NetworkManager program to manage Internet connections. She
Hot Standby Router Protocol (HSRP) Questions and Answers Questions Introduction Does failover to the standby router occur when the LAN interface for the active router is stateful?
Laboratory work. Design and Implement Addressing Scheme for a Subnetted IPv4 Network Topology Addressing Table Device Interface IP Address Subnet Mask Default Gateway R1 G0/0 G0/1 Lo0 Lo1
Laboratory work. Troubleshooting IPv4 and IPv6 Static Routes Topology This document is public information from Cisco. Page 1 of 12 Addressing table
Firewall Rules Firewall Rules Firewall uses two types of rules to control network connections: Packet rules. Used to enforce general restrictions on network activity
Administration of local networks Lecture 10. Analysis and troubleshooting Contents of the lecture Determination of problems in TCP / IP protocols. How TCP/IP Client Configuration Affects Performance
Laboratory work. Using the Command Line Interface (CLI) to Gather Network Device Information Topology Addressing Table Device Interface IP Address Subnet Mask Default Gateway Tasks
Laboratory work. Troubleshooting DHCPv6 Operation Topology Addressing Table Device Interface IPv6 Address Prefix Length Default Gateway R1 G0/1 2001:DB8:ACAD:A::1 64 N/A S1
Route Selection in Cisco Routers Contents Introduction Prerequisites Requirements Components Used Conventions Related Processes Building the Routing Table Redundant
Lab : Designing and Implementing a Subnetted IPv4 Network Addressing Scheme Topology Addressing Table Device Interface IP Address Subnet Mask Default Gateway Tasks R1 G0/0 N/A
Topology Addressing Table Device Interface IP Address Subnet Mask Default Gateway G0/0 192.168.10.1 255.255.255.0 N/A R1 R2 PC1 PC2 PC3 PC4 G0/1 192.168.11.1 255.255.255.0 N/A S0/0/0
Configuring a connection under Linux Ubuntu 12.04 Access type NAT Graphical mode (GUI) Ubuntu uses the NetworkManager program to manage Internet connections. She
IT Essentials 5.0 6.3.2.7 Lab Configuring a Network Card to Use a DHCP Server on Windows 7 Introduction Print and complete this lab. In this lab work
"WINDOWS NETWORK UTILITIES" TASK Compiled by: Korobetskaya A.A. On the Windows command line, do the following: 1. Determine the name of the local host using the hostname utility. 2. Determine the MAC address of all network
LABORATORY WORK 1 "IPconfig, arp, ping, tracert, nslookup network utilities 1. WORK PURPOSE Familiarization with ipconfig, arp, ping, tracert, nslookup network utilities.
Restoring the firmware of irz RUH/RUH2/RCA routers Connect the router directly to the computer using a crossover network cable (usually marked with a red “crosswired” label) and connect it to the COM port
Laboratory work. Using Wireshark to Analyze Ethernet Frames Topology Tasks Part 1: Examine Header Fields in an Ethernet Frame II Part 2: Capture and Analyze Ethernet Frames with
OSPF Neighbor Issues Description Contents Introduction Prerequisites Requirements Components Used Conventions Adjacencies Neighbor States Status Not Discovered Neighbor in
Configuring access to IP cameras and network recorders (NVR) from the Internet. Version 1.0 Contents Accessing the IP Camera to the Internet.... 3 1 Connecting the IP Camera to the LAN.... 3 1.1 Definition
Laboratory work 5.2.3. Configure RIPv2 with VLSM and Default Route Propagation Encrypted Password Password Mask Mask Mask
Configuring the D-link DIR300NRU router for the Intek-M network. Access type NAT (direct access). First of all, you need in the properties of the Internet Protocol TCP / IP (Windows XP) or Internet Protocol version
Laboratory work. Inter-VLAN Routing Troubleshooting Topology This document is public information from Cisco. Page 1 of 9 Addressing table
CCC CERTIFICATE OS 2 SP 0717 Digital transmission system MC04 DSL Network management module Vport (Eth-Ctrl) KV5.231.021 TO (rev.2 / August 2010) ADS Perm Contents: 1. Description and technical characteristics
Laboratory work. EIGRP Advanced Troubleshooting Topology This document is Cisco Public Information. Page 1 of 9 Addressing table
Lab : Examining Ethernet Frames with Wireshark
Packet Tracer: Ping and Tracing to Verify Path Topology This document is public information from Cisco. Page 1 of 6 Addressing table Device
IT Essentials 5.0 6.3.2.8 Lab Configuring a Network Card to Use a DHCP Server in Windows Vista Introduction Print and complete this lab. In this lab work
Configuring network settings in Windows XP Table of contents Connection diagram WITHOUT using a home router... 1 How to check the connection... 5 Connection diagram using a home router...
Topology This document is Cisco Public Information. Page 1 of 5 Addressing Table Device Interface IP Address Subnet Mask Default Gateway G0/0.15 G0/0.30 G0/0.45
This device can be configured using any modern web browser such as Internet Explorer 6 or Netscape Navigator 7.0 DP-G301 AirPlus TM G 2.4 GHz wireless print server Before
INSTALLATION INSTRUCTIONS FOR XPRINTER DRIVER SETUP V7.77 SOFTWARE Download link for XPrinter Driver Setup V7.77: http://www.xprinter.com.ua/image/data/product/download/xprinter%20driver%20setup%20v7. 7
ZELAX ROUTERS Instructions for downloading software using the 2001-2005 Zelax resident bootloader. All rights reserved. Revision 03 dated May 18, 2005 Russia, 124681 Moscow,
Instructions for configuring TP-LINK TL-WR1043ND via PPPoE protocol. Table of contents Connecting to a router via an Ethernet cable (LAN).... 2 Connecting to a router via a wireless network (Wi-Fi)....
Laboratory work 4. Configuring the router. Statistical Routing A router is a device designed to transfer packets between networks. When determining the path of a packet, the router
Configuring network settings in Windows 7 Table of contents Connection diagram WITHOUT using a home router... 1 How to check the connection... 5 Connection diagram using a home router...
Configuring network settings in Windows 10 Table of contents Connection diagram WITHOUT using a home router... 1 How to check the connection... 5 Connection diagram using a home router...
A brief overview of the connection procedure, installation and operation features of 1-4Eth-modem-routers Zyxel P-660 xx VERSION 2 when connecting to ADSL from Ukrtelecom for users of the Windows OS family
Laboratory work. Configuring a NAT Pool with Overload and PAT Topology Addressing Table Device Interface IP Address Subnet Mask Default Gateway Tasks Gateway G0/1 192.168.1.1 255.255.255.0 N/A S0/0/1
Laboratory work. Configuring IPv6 Static Routes and Default IPv6 Routes Topology Addressing Table Device Interface IPv6 Address/Prefix Length Default Gateway Tasks R1 G0/1 2001:DB8:ACAD:A::/64
GUIDE FOR SETUP AND WORK WITH INTERFACE CONVERTER T-11. Version 1.0 Year 2011 Contents Introduction... 3 General information... 3 Topology of connecting converters in ACS "Reverse"... 4 Changing settings
Introduction to the ip unnumbered command and its configuration Contents Introduction Prerequisites Requirements Components used Conventions What is an unnumbered interface? IP and unnumbered
LLC "Company" ALS and TEK "Software of the family of switches ALS-24000, v. 6.01 Installation manual Sheets 13 2017 2 1. GENERAL INFORMATION 3 1.1. Purpose and scope 3 2. COMPUTER REQUIREMENTS
ER75iX Twin firmware recovery Connect the router directly to the computer using a crossover network cable (usually marked with a red “crosswired” label) and connect it to the computer’s COM port
Using VRRP on Moxa L3 Switches Configuring Default Gateway Redundancy Using VRRP VRRP (Virtual Router Redundancy Protocol) is a network protocol designed to increase
USB over IP Network Server with 4 USB 2.0 Ports User Manual DA-70254 Contents 1. Introduction... 3 1.1 Product Overview... 3 1.2 Network Management... 3 1.3 Parts and Functions... 3 1.4 Hardware
IT Essentials 5.0 10.3.1.10 Lab Configuring the Windows XP Firewall Print and complete this lab. This lab examines the Windows XP firewall and performs
Goal of the work:
- 1. Familiarize yourself with network modeling techniques using Cisco Packet Tracer software.
- 2. Obtaining skills in building and modeling networks using hubs, switches, routers.
- 3. Gaining skills in using the ping, tracert, arp commands to monitor the state of a computer network.
Theoretical part.
Description of Cisco Packet Tracer.
Cisco Packet Tracer is a software product developed as part of network academies by Cisco and allows you to design networks, study network equipment, links between them and configure them.
Figure 1 - Main components of the Cisco Packet Tracer program
- 1- Workspace, where the equipment for organizing the network is located;
- 2- Available equipment (hubs, switches, routers, end devices);
- 3- Buttons for managing objects;
- 4- Choice between physical and logical workspace. A feature of Packet Tracer is that when you go to the physical workspace, you can view the created network at the level from the virtual city to the rack. The transition to a lower level - by clicking on the object. Return - Back button;
- 5- Window for monitoring and managing transmitted packets;
- 6- Switching between operating modes - real-time and simulation. In simulation mode, all packets sent within the network are displayed graphically (Figure 2). This feature allows you to visually demonstrate which interface the packet is currently moving on, which protocol is being used, and so on. In this mode, you can not only track the protocols used, but also see which of the seven layers of the OSI model this protocol is used by clicking on the square in the Info field (Figure 3).
Figure 2 - Packet transmission in simulation mode
Figure 3 - OSI Model Layers in Cisco Packet Tracer
You can start work in simulation mode by generating a ping - request with or and pressing the Play button.
Each device can be configured depending on its purpose. For example, by clicking on the computer icon, we get to the physical settings area, which shows the appearance of the equipment and lists the boards that can be added to the device. The Config tab (Figure 4) shows the network settings of the device (IP, mask, gateway, DNS server).
Figure 4 - Computer network settings
The Desktop tab provides additional options:
- · IP Configuration - network settings
- · Command Prompt - command line
- Terminal
- Browser
- · E-mail and more.
The command line is used to test network functionality, set settings, and view results. Basic commands when using:
Ping - sending an echo request
Format: Ping destination_address.
Can be with extensions: Ping -t destination_address - send echo request until interrupted by Ctrl+C command;
Ping -n count destination_address Sends as many pings as count specifies.
· Arp - a - view arp-table;
Arp - d - Clear the arp table.
· Tracert - determine the route to the destination node.
Format: Tracert destination_address.
STP protocol.
Spanning Tree Protocol is a network protocol that operates at the second layer of the OSI model. The main objective of STP is to bring a multi-link Ethernet network to a tree topology that eliminates packet loops. This happens by automatically blocking currently redundant connections for full port connectivity. The protocol is described in the IEEE 802.1D standard.
CDP protocol.
Cisco Discovery Protocol is a Layer 2 protocol developed by Cisco Systems that allows discovery of connected (directly or through Layer 1 devices) Cisco network equipment, its name, IOS version, and IP addresses. It is supported by many devices of the company, almost not supported by third-party manufacturers.
The information received includes types of connected devices, router interfaces to which neighboring devices are connected, interfaces used to create connections, and device models.
ICMP protocol.
Internet Control Message Protocol is a control message protocol.
Using ICMP, hosts and routers communicating over IP can report errors and exchange limited control and status information.
Each ICMP message is sent over the network within an IP packet (Figure 5). IP packets with ICMP messages are routed just like any other packets, without priority, so they can also be lost. In addition, on a busy network, they can cause additional load on routers. In order not to cause an avalanche of error messages, IP packet losses carrying ICMP error messages cannot generate new ICMP messages.
Figure 5 - ICPM Packet Format
Static and dynamic routing.
Routing is the process of determining the route of information in communication networks. Routes can be set administratively (static routes) or calculated using routing algorithms based on information about the topology and network state obtained using routing protocols (dynamic routes). After determining the route of the packet, it is necessary to send information about this to each transit device. Each message is processed and entered into the routing table, which indicates the interface on which the device should transmit data related to a particular stream.
RIP protocol.
Routing Information Protocol - Routing information protocol. Used to change entries in the routing table automatically. To measure the distance to the destination, the number of hops is most often used - the number of intermediate routers that a packet needs to overcome to reach its destination (although there may be other options - network reliability, delays, throughput). Routers send their routing table to neighbors, receive such messages from them and process them. If the new information has a better metric value, then the old entry is replaced by the new one, and the router sends the RIP packet to its neighbors again, waits for a response, and processes the information.
ARP protocol.
Any device connected to a local network has a unique physical network address, set in hardware. The 6-byte Ethernet address is selected by the manufacturer of the network interface equipment from the address space allocated to it under the license. If a machine's network adapter changes, its Ethernet address changes as well.
The 4-byte IP address is set by the network manager based on the location of the machine on the Internet. If the machine is moved to another part of the Internet, then its IP address must be changed. The conversion of IP addresses to network addresses is done using the arp table. Each network machine has a separate ARP table for each of its network adapters.
Address translation is done by looking up the table. This table, called the ARP table, is stored in memory and contains rows for each host on the network. The two columns contain the IP and Ethernet addresses. If an IP address needs to be converted to an Ethernet address, then the entry with the corresponding IP address is looked up.
The ARP table is needed because IP addresses and Ethernet addresses are chosen independently, and there is no algorithm to convert one to the other.
There are the following types of ARP messages: ARP request (ARP request) and ARP reply (ARP reply). The sending system requests the physical address of the receiving system using an ARP request. The response (the physical address of the destination host) comes in the form of an ARP response.
Before passing a network-layer packet over an Ethernet segment, the network stack checks the ARP cache to see if the required information about the destination host is already registered in it. If there is no such entry in the ARP cache, then an ARP broadcast request is made. The sender will then update its ARP cache and be able to send the information to the recipient.
A host that needs to map an IP address to a local address generates an ARP request, attaches it to a link-layer protocol frame, indicating a well-known IP address in it, and broadcasts the request.
All nodes on the local network receive an ARP request and compare the IP address specified there with their own.
If they match, the node generates an ARP response, in which it indicates its IP address and its local address, and sends it already directed, since the sender specifies his local address in the ARP request.