To make timely and correct management decisions, each organization needs up-to-date information about the availability of goods in warehouses, about its cost, about sales. Trade organizations work with a large number of items and counterparties, and this requires a good setup of analytical accounting and quick receipt of the required information from its data. The article discusses the basic methods of working with standard reports in the standard solution "1C: Trade Management 8" (version 11), built on the basis of the data composition system and provides useful practical recommendations that will be useful for both novice users and those who have switched to the new edition from previous editions.
For example, take a report
- Analysis of the availability of goods;
Setting.
In a collumn Comparison type Nomenclature
- Equals
- Not equal
- Listed
- Not in the list
- In Group Nomenclature;
- Not in a group Nomenclature;
- In a group from the list Nomenclature;
- Not in a group from the list Nomenclature.
Meaning
"Quick Selections"
As the 1C:Enterprise 8 platform develops and the new version 8.2 appears, reports in systems become more flexible, and users have more and more opportunities to customize them to their requirements without the help of programmers.
The new capabilities provided by the data composition system (ACS) allow you to feel the benefits of 1C:Enterprise 8 capabilities when building reports like never before. And, despite the fact that the reporting interface has undergone significant changes (compared to edition 10.3 of the Trade Management configuration, hereinafter referred to as UT), the report settings are still available to the average user. Let's take a look at some basic ways to work with them.
The first thing you can pay attention to is quick selections. They allow you to display data in the report according to certain values of the report fields according to the wishes of the user.
For example, take a report Analysis of the availability of goods in UT. We note right away that the entire demonstration of the capabilities of reports in UT 11 will take place on the example of two reports:
- Analysis of the availability of goods;
- Revenue and cost of sales.
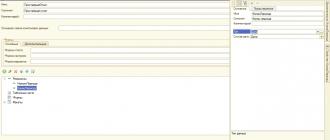
Selection by some fields can be done either directly in the report form or by clicking the button Setting.
In a collumn Comparison type The user can select different comparison conditions. For example, for the field Nomenclature You can choose from the following types of comparison:
- Equals- the report will be built only for the selected nomenclature position;
- Not equal- the report will be built for the entire range, except for the selected position;
- Listed- the report will be built according to the list of nomenclature items;
- Not in the list- the report will be built for the entire range, except for the selected items;
- In Group- the report will be built on all the nomenclature located in the selected folder of the directory Nomenclature;
- Not in a group- the report will be built on the entire nomenclature, except for the items located in the selected folder of the directory Nomenclature;
- In a group from the list- similar to comparison In the list, only folders in the directory are selected as list values Nomenclature;
- Not in a group from the list- similar to comparison Not in the list, only folders in the directory are selected as list values Nomenclature.
The checkbox (tick) to the left of the selection field indicates that selection by this field is “on”, i.e., it is taken into account by the report.
Unchecked fields are not taken into account even if you have selected certain values for these fields.
Depending on the selected type of comparison in the column Meaning a specific element or folder (group) of the directory, or a list of elements or folders is indicated.
Quick selections are available in all solutions based on the 1C:Enterprise 8 platform.
An example of a simple change in report settings
To view/change the report settings, go to the menu All actions - Change option.
Before us opens the settings window for the selected report option.
The structure of the report is displayed at the top of the window. In fact, this is a visual display of groupings of rows and columns of the report, i.e. in what order the analytics data will be displayed in the report in rows and columns.
The lower part of the window displays those related to the report as a whole (if the top level is selected in the report structure). Report), or to a certain grouping of rows or columns of the report (if the grouping is selected at a level below), settings for displaying information and designing fields.
Example 1
Step 1. We need to remove the grouping by item characteristics, leaving only the grouping by item. To do this, in the upper part of the report settings window, click on the field Nomenclature, Characteristic. At the bottom of the window, go to the tab Groupings.
Select a field Characteristic and click on the button Delete command panel.
Confirm changes to the report settings by clicking on the button Finish editing in the lower left corner of the screen.
Step 2 After removing the characteristic, our task, according to the conditions of the example, will be to add a price group. According to the meaning, this grouping should go a level lower than the grouping by stock, but a level higher than the grouping by item. Therefore, in the structure of the report, we select a grouping Stock.
By clicking on it with the right mouse button, in the context menu, select the command New grouping.
In the grouping field editing window that opens, select Nomenclature.Price group.
By clicking on the button OK, we will see that a new grouping has been added to the report, subordinate to the grouping Stock.
Now let's select the grouping by item and, without releasing the right mouse button, drag it inside (i.e. below) the grouping by price group. We will get the structure shown in Figure 1. The result of setting up the report is shown in Figure 2.
Rice. 1. The resulting report structure
Rice. 2. Result of report customization
Working with custom fields
Let's now take a closer look at the new reporting options in the 1C: Trade Management 8 program.
In the form of editing the structure and settings of our report, pay attention to the tab Custom fields.
Before that, we added fields to the report, the list of which was predefined by the developer. With this tab, we can create our own fields we need - field-select or Field expression.
Example 2
|
Let's customize the report "History of sales" (version of the report "Revenue and cost of sales"). Let's display data on sales in the context of partners and nomenclature. Suppose that our company is engaged in the sale of goods in Moscow and in the regions. Thus, each client in the infobase belongs to a certain geographic region (props "Business region" of the directory "Partners"). We can easily group sales data in a report by regions, but what if we are interested in more aggregated statistics, in particular, the answer to the question “How many goods were sold in Moscow, and how many in all other regions combined”? This is where custom fields come in handy. |
Step 1. Let's open the report. Let's go to the report structure settings form ( All actions -> Change variant). Let's delete in turn all the groupings previously created in the report - to do this, select each of them and click on the button Delete command bar, or use the DEL key.
Just like in the previous example, let's add a grouping to the report by partner, and then by product. We already know how to do it, so it won't take much time.
Step 2 Let's create a new custom field. Let's open a bookmark Custom fields and run the command Add -> New field-select.
Let's name our new field - Region in general.
Let's click on the button Add. In a new line, click on the button in the column Selection. In the selection editing form that appears, add a selection by field Partner.Business region. Choose the type of comparison Equals, meaning - Moscow.
Let's click on the button OK, after which we will return to the custom field editing window. Next, click on the button in the column Meaning and in the data type selection list that appears, select Line and write as value Moscow.
Let's repeat the operation. Let's add another row to the table. This time for field selection Partner.Business region choose the type of comparison Not equal.
Returning to the custom field editing window, in the column Meaning write Other regions(See Fig. 3).
Rice. 3. Custom Field Editing
Let's click on the button OK. Our new field is ready.
Step 3 Let's add our new field to the report structure. Highlighting the top level Report in Structure, add a new grouping. In props Field choose Region in general.
Drag the grouping by partner and its subordinate grouping by product range into the newly created grouping with the mouse.
Let's generate a report and look at the result (shown in Fig. 4).
Rice. 4. The result of the report generation
Selection and sorting
Let's return to the window for editing the structure and settings of the report and pay attention to the tabs Selection And Sorting.
If the root element is selected in the report structure ( Report), then the settings made on these tabs will apply to the entire report as a whole. If some report grouping is selected, then the settings will apply only to it.
Example 3
As a result, the report Sales history only those implementations will get where the manager is specified Ivanov Ivan Fyodorovich.
Example 4
Save the changes made
If you change the structure of a report, you can always save it using the command All Actions -> Save Variant.
In the form of saving a variant, using the switch, you can select Save to existing report variant(instead of one of the options already available), or Save the new version of the report.
Consider creating an external report in 1s 8 without using a data composition system. To create an external report, we will use the Accounting 2.0 configuration, the initial data: “Write a report on the 62 accounting account in which the turnover for the specified period will be displayed in the context Counterparties And Contracts of counterparties.
1. Create a report
First of all, we will create an external report file, for this we will go to 1s 8 in the mode Configurator, go to the menu File -> New or click on the icon new document.
Select an item from the list External report. After creating an external report, give it a Name (for example SimplestReport) and save it to disk. We will also add two props: Beginning of period And EndPeriod type date, we will need them to limit the time interval for sampling data when generating a report.

2. Create an external report layout
To generate a report in 1s 8, you need a layout, this is a template for data output in which all the necessary parameters are set, tables are drawn, etc. Let's add a new layout, for this, in the report metadata tree, select the item Layouts and press the button Add, when creating, select the type for the layout spreadsheet document.

Our layout will have 4 areas:
- Header - in this area we will display the name of the report, the period for which it was generated and the header of the table;
- Counterparty data - in this area we will display data on the counterparty in the table;
- Counterparty Agreement Data - in this area we will display data on the counterparty agreement in the table;
- Footer - in this area we will display the total values for the entire report for the fields Income and Expense.
Let's start creating layout areas. In order to create an area in the layout, select the required number of lines and click Menu Table -> Names -> Assign Name(Or Ctrl+Shift+N). To area A cap write the name of the report: Turnover 62 accounts, draw with the tool Borders report header, as well as set the parameters Beginning of period And EndPeriod. With the help of parameters, you can display the necessary data in the report, we will deal with this at the next stage of development, namely when writing the program code of the report. To create a parameter in the layout, select the desired cell, write the name of the parameter in it (without spaces), right-click on it, select the item in the menu that opens Properties. In the properties of the cell on the tab Layout select filling Parameter.

After that, in the cell, the parameter name will be enclosed in angle brackets (”<>“). As a result, the area A cap should look like this:

In area DataContractor we will create parameters for displaying the name of the counterparty, as well as for income and expenses for account 62, using the tool Borders Let's design the area in the form of a table row.
In area DataAgreementContractor we will create parameters for displaying the name of the contract, as well as for income and expenses for account 62, using the Borders tool, we will draw up the area in the form of a table row. Let's make a small indent before the parameter Counterparty Agreement(this can be done by splitting and merging cells. Right-click on the cell -> Merge or Break cell), it is needed in order to show in the report that the contract line is lower in the hierarchy than the counterparty line.
In area Basement Let's create parameters for the totals for receipts and expenditures.
As a result, we should get a layout like this:

3. Create a report form
To display data, set the period of formation and buttons Form our report will need a form. To create a form, find the item in the metadata tree of the external report Forms and press the button Add. On the first page of the form builder, you don't need to make any changes, just click the button Further.

On the next page of the constructor, select both available props( Beginning of period, EndPeriod) for placement on the form.

As a result, we get this form:

But in this form it does not suit us, we will make some changes to it:
- Drag button Form from the bottom panel of the report to the top one (this will be more convenient for the user);
- Stretch the shape vertically and horizontally;
- Arrange the fields Beginning of period And EndPeriod horizontally;
- Add a Spreadsheet Document Field control to the form (our report will be displayed in it), give it a name TabDoc;
- Let's create a period selection button (when it is pressed, a dialog will be displayed with a convenient selection of the desired period). We will not write the program code for it yet, so we will simply place the button next to the period fields.
As a result, our form will look like this:

4. Programming
After creating the report form, let's start programming. First, let's create a procedure for displaying a period selection dialog (we already created a button for this at the previous stage). Right-click on the button and select the menu item Properties, in the properties of the button go to the tab Events, where using the button with the magnifying glass icon we will create a procedure Button1Press in the form module.

You can switch between the form and its module using the tabs at the bottom of the form

To call the period selection form, we use the standard procedure Accounting 2.0 from the general module Working with Dialogs - HandlerPeriodSettingPressing, you need to pass the details of the report as parameters to it Beginning of period And EndPeriod.
Procedure Button1Press(Item) Working with Dialogs.HandlerSettingPeriodPress(StartPeriod,EndPeriod); EndProcedureNow let's move on to writing the code that will generate and display our report. There is already a procedure in the form module ButtonFormPressing which will be executed when the button is clicked Form, then we will write our code there. Let's start by initializing the necessary variables. First, let's create a variable for spreadsheet fields to which we will output data, this is not necessary, just the recording of calls to it will become shorter, which means that the program code will be more understandable for reading.
TabDoc = FormElements.TabDoc;
Get the layout of the external report using the function GetLayout(<ИмяМакета>) , we will pass the name of the layout to the parameter, and if such a layout exists, then the function will find it.
Layout = GetLayout("Layout" );
After the layout is received, we will create variables for each of its areas, we will use the layout method for this GetRegion(<ИмяОбласти>) .
AreaHat = Layout.GetArea("Hat"); AreaDataAccount = Layout.GetArea( "DataContractor"); AreaDataAgreement = Layout.GetArea("DataAgreement" ); AreaFooter = Layout.GetArea("Basement" );
Clear the spreadsheet field. This is necessary so that with each new report generation, the old data is deleted.
TabDoc.Clear();
Now that the initialization of the variables is complete, let's move on to filling and displaying the layout areas one by one. Let's start with the hat. If you remember, we created two parameters in this area Beginning of period And EndPeriod, we will pass the values of the report generation period there, for this we will use the property Options layout area.
Header.Parameters.PeriodStart = PeriodStart; AreaHeader.Parameters.EndPeriod = EndPeriod;
No more scope action A cap the manufacturer is not needed, so we will display its field in a spreadsheet document.
TabDoc.Output(RegionHeader);
Next, let's write a query to the database, with the help of which we will take the turnover on the account 62 from the accounting register self-supporting. Let's define a variable in which our request will be located.
Request = new Request;
Before we start writing the request text, we will pass the necessary parameters to it. Since we are writing a request for an invoice 62 accounting, then first of all we will create a parameter for it
Query.SetParameter("Account62" ,Charts of Accounts.Self-supporting.FindByCode("62" ));
It is also necessary to pass the period of report generation to the request. Do not forget that we have special report details for the generation period, and we pass them as parameters.
Query.SetParameter("StartPeriod",StartPeriod); Query.SetParameter("EndPeriod",EndPeriod);
Let's start writing the query text, we will do this using the query builder. Many tutorials say that you need to be able to write a query both manually and using the constructor, but in practice this is not the case. In tasks that are constantly faced by a 1C programmer, the priority is fast and high-quality writing of code, and when compiling a query to the database manually, this is almost impossible to achieve, you will spend a lot of precious time to correctly reproduce all query constructions, find typos which you did when writing, etc. So don't waste your time trying to write queries manually, but use the query constructor. It will save you time and allow you to write complex queries without much effort. To start writing the text of the request, let's write in the code:
Request.Text = "" ;
After that, put the cursor between the quotes, press the right mouse button and select the item Constructor request. The query designer window will open.

Now we need to select the 1C 8 database table we need. We need a virtual table Turnovers accounting register self-supporting. Find it on the left side of the designer window

Let's move it to the area tables and let's fill in the parameters. For all virtual tables of the query, there is a special set of parameters that allow you to select the necessary data from the main table (in our case, the main table Accounting Register self-supporting). Let's open the virtual table parameters window.

Let's fill in the parameters, the period that we passed to the request. In order to use a parameter in the request text, you must write a symbol before its name ampersand(&)

It remains to fill out the condition on the account. accounting. To do this, find the line in the parameters of the virtual table ConditionAccounts and write there
Score IN HIERARCHY (&Score62)
You can also use the condition builder by clicking on the button with three dots.

No more conditions need to be imposed on the virtual table, so press the button OK in the virtual table options window. Next, we need to select the fields we need from the table Self-supporting. Turnovers(namely: Counterparty, Counterparty Agreement, Income and Expenditure). To see the list of fields available in the table we have selected, press the “+” symbol next to its name. After that, drag the required fields to the rightmost area of the query builder, which is called: Fields. If we open the chart of accounts of accounting, we will see that for the account 62 analytics by To the counterparty - this is Subconto1, and by Contractor Contract — Subconto2.

Therefore, from the fields of the virtual table, select Subconto1 And Subconto2. Since we need income and expenses by amount, we also select the fields AmountTurnoverDt And AmountTurnoverKt

Let's fill in the aliases of the fields we have chosen, for this we will go to the tab Unions/Aliases and set the desired field names.

Since in our report the data will be displayed hierarchically (the Counterparty is on the first level, and all its contracts are on the second), we will set up the data output in the hierarchy using the Results. Let's go to the tab in the constructor Results. Drag and drop into grouping fields sequentially counterparty And Counterparty Agreement, and in the final Coming And Consumption.

This completes the work in the query constructor, click the button OK and we see that the text of our request appeared in the program code.
Query.Text = "SELECT | Self-supporting Turnovers. Subconto1 AS Counterparty, | Self-supporting Turnovers. Subconto2 AS Contractor's Agreement, | Self-supportingTurnovers.AmountTurnoverDt AS Incoming, | Self-supportingTurnovers.AmountTurnoverKt AS Expense| FROM | RegisterAccounting.Self-supporting.Turnovers(&Beginning of the Period, &End of the Period, Account IN THE HIERARCHY (&Account62),) AS Self-supportingTurnovers| RESULTS | SUM(Income), | SUM(Expense) | ON | counterparty, | Counterparty Agreement";
After we have finished writing the request, we will start filling in the areas DataContractor, DataAgreementContractor And Basement. We will fill all these areas with the data received when executing the request. Since our query contains groupings( counterparty And Counterparty Agreement) select data from it as follows:
SamplingAccount = Query.Execute().Select(BypassingQueryResult.By Groupings);
Thus, we will receive records with totals for all counterparties.
Before bypassing the sample data using a loop, we initialize the variables intended for calculating the totals for the report:
TotalIncome = 0; TotalExpense = 0;
In order for the report data to be displayed with a hierarchy (and spreads by ”+”), set the start of autogrouping of spreadsheet document rows:
TabDoc.StartAutogroupRows();
All preparations are finished, now let's start bypassing the query results. The bypass will be carried out using the loop Bye
While SelectionContractor.Next() Cycle EndCycle ;At the beginning of the loop, reset the parameters Coming And Consumption areas DataContractor. What is it for? Imagine a situation where the counterparty Uncle Vasya, income 10, and expense 5, and for the next counterparty Uncle Petya there is no income or expense, in this case, if we do not reset the parameters Coming And Consumption, then by in the line by counterparty Uncle Petya there will be an income of 5 and an expense of 10.
AreaDataAccount.Parameters.Incoming = 0; AreaDataAccount.Parameters.Expense = 0;
After that, fill in the area DataContractor sample item data
Fill inPropertyValues(AreaDataAccount.Parameters, SelectionAccount);
After filling with data, you can display the area in spreadsheet document, Since we use automatic grouping of lines, we need to specify the level of the line in the grouping (in our report there will be two levels, for counterparties the first for contracts the second).
TabDoc.Output(AreaDataAccount,1);
Now for this counterparty we will make a selection according to its contracts.
SelectAgentContract = SelectContractor.Select(BypassingQueryResult.By Groupings);
The bypass will be carried out using the loop Bye.
While SelectionAgreementContractor.Next() Cycle EndCycle ;In the cycle for contracts of counterparties, we will reset the parameters Coming And Consumption, fill the area DataContract from the selection and display it in a spreadsheet document at the second level of records.
AreaDataAgreement.Parameters.Income = 0; AreaDataAgreement.Parameters.Expense = 0; Fill inPropertyValues(AreaDataContract.Parameters, SelectionContractorContract); TabDoc.Output(AreaDataContract,2);
Also in this cycle, we will add the current values to the variables for calculating the total values for income and expense.
TotalIncome = TotalIncome + SelectionAgreementContractor.Income; TotalExpense = TotalExpense + SelectionContractor's Agreement.Expense;
This concludes the data output in the area DataContractor, DataAgreementContractor completed, it remains to complete the auto-grouping of spreadsheet document rows.
TabDoc.EndAutoGroupRows();
Fully cycles responsible for outputting data to the area DataContractor And DataAgreementContractor look like this:
TabDoc.StartAutogroupRows(); While SelectionContractor.Next() Loop AreaDataContractor.Parameters.Incoming = 0 ; AreaDataAccount.Parameters.Expense = 0 ; Fill inPropertyValues(AreaDataAccount.Parameters, SelectionAccount); TabDoc.Output(AreaDataAccount,1 ); SelectAgentContract = SelectContractor.Select(BypassingQueryResult.By Groupings); While SelectionAgreementContractor.Next() Loop AreaDataAgreement.Parameters.Incoming = 0 ; AreaDataAgreement.Parameters.Expense = 0 ; Fill inPropertyValues(AreaDataContract.Parameters, SelectionContractorContract); TabDoc.Output(AreaDataAgreement,2 ); TotalIncome = TotalIncome + SelectionAgreementContractor.Income; TotalExpense = TotalExpense + SelectionContractor's Agreement.Expense; EndCycle ; EndCycle ; TabDoc.EndAutoGroupRows();
It remains to display the total data in the area Basement and display the area itself in spreadsheet document.
AreaBasement.Parameters.TotalIncome = TotalIncome; AreaBasement.Parameters.TotalExpense = TotalExpense; TabDoc.Output(RegionFooter);
This completes the process of writing an external report for 1C 8 without using ACS. Now it can be generated in 1C:Enterprise 8 mode and added to the directory ExternalProcessing You can download the report file discussed in the article by .
Watch the video on creating an external printable for a managed app:
In the "Reports" section, there are many different reports for each type of activity. Basically, they are enough for everyday accounting. But sometimes, in order to analyze a particular problem, it is necessary to dig deeper, up to comparing, for example, records in a document and in the registers that it affects. And there are times when standard reports are simply not enough.
For such a deep data analysis or to create your own report in the 1C 8.3 program, there is a "Universal Report". I am going to consider its possibilities in this article.
General description of the universal report in 1C 8.3
First, let's figure out where to find a universal report? If you go to the "Reports" menu, and then click the "Universal Report" link, we will see the following window:
Let's briefly go through its controls.
Finished with the top line.
- Below the most interesting button is the "Show Settings". Here it is better to show with an example.
Instructions for setting up a universal report 1C 8.3
Since we are working in the 1C: "Enterprise Accounting 3.0" program, we are primarily interested in accounting registers. In configuration 3.0, only one is available to us - “accounting and tax accounting”. We select it. Let's see the turnover on 10.01 "Materials" account.
Get 267 1C video lessons for free:
We choose a period. It will be the whole of 2012 for me. Next, click the "Show Settings" button:

To get the names of the materials, select the grouping by the 1st subconto. It is in it that the name is stored, more precisely, a link to the nomenclature.
Go to the "Selections" tab:

Here we need to specify that we only want to see the score 10.01.
If you wish, you can specify here as many selection conditions as you like.
Let's press the generate button and see what we got:

It can be seen that there are too many unnecessary columns in the report. Such as currency accounting, tax accounting and so on. I do not keep these records, and I want to remove these columns from the report.
We go back to the settings and immediately - to the "Indicators" tab:

We remove the flags from those columns that we do not need to display.
On the "Generate" tab, you can specify the field by which sorting will occur. For example, I want my materials to come out alphabetically:

In our example, the report shows the output of products and services by departments, item groups, and broken down by months.
Here is the main page of the report:
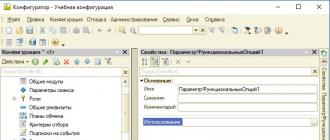
This page is called from the configurator in the menu File - New - External report.
First, we add a dataset (DataSet1). In the "Request" window, you can type it yourself, create it using the Request Builder, or load it from a file. The most convenient way is to use the query constructor. Read how the constructor works.
Everything that is needed is filled in automatically, but some things need to be tweaked.
For example, column headings (the “Quantity” checkbox in the figure above allows you to type any heading text for this field), you can set the data output format (see Format in the Quantity line). The format is editable for any kind of data - strings, dates, numbers.
On the Resources tab, select the resources themselves and configure the output of results for them:

The Parameters tab contains everything that changes the contents of the report (for example, the period for which data will be selected). It is filled in automatically based on the request parameters (see the first page). With checkmarks, you can adjust the visibility, availability of these parameters, set the initial value, etc.:
Get 267 1C video lessons for free:

And finally, Settings. Here the appearance of the report is drawn - columns, rows, their position relative to each other, groupings, etc. The "Open settings designer" button will help you arrange the lines and columns in the desired order. The button "Custom element settings" will allow you to display the parameters in the report header:

Pay attention to the Period.Parts ofDates.Name of the Month column. How to display the name of the month in the column heading? This is where it comes out.
By the way, it is this setting that allows you to display data for several periods at once in adjacent columns of the report:

Another important tab is Selected Fields. If it is empty, the report will not be generated. It is usually filled in automatically by clicking the "Open settings designer" button:

Actually, that's all you need from the minimum required. As a result, we will have a report of the following form:
SKD stands for Data Composition System. SKD is a mechanism of the 1C platform for developing reports. The report is generated without the need to write code. With the help of a certain constructor and the settings made in it, the programmer sets the desired result, the data composition system understands this and displays this result to the user. If you need to change something in the report, you just need to turn to the designer again, make the necessary changes and the modified report is ready. The disadvantage of ACS is that its settings are rather complicated and not all users learn them quickly.
What is the technology for creating an SKD report:
Write a 1C request to the ACS that provides data
Specify ACS the role of fields (calculated fields, resources)
Enter the default ACS settings.
The user has the opportunity to change many settings at will.
ACS has a significant advantage for both the user and the programmer:
Programmer - saves you from writing a program to perform a report and settings
User - Gets significant access to report settings.
In all new 1C configurations, all reports will be used only on 1C SKD.
Create a report.
Select menu File -> New. Select the file type - New Report.
A new report is being created. Let's create a new ACS scheme by clicking the Open data composition scheme button.
Create a query for a report.
There can be many sources of data for SKD 1C. To use, for example, two separate queries - first add "Dataset - Join", and then several queries. In our example, we will use a query.

A query is built using the Query Builder. Working with the query constructor in SKD is no different from the usual one.

As a result of the request formation, the ACS will create a list of fields available for use and fill in the names with it by default. The name can be changed.

SKD settings.
On the Resources tab, specify the fields that will be summarized for the totals. Resource totals can be calculated using the SKD expression language functions - Sum(), Average(), Maximum(), Minimum() and Quantity(). Default Amount.

The construction of virtual tables of accounting registers, accumulation registers, information registers depends on the specified date. The ACS is designed so that if the report is based on a virtual table, then it is necessary to let the user choose for what interval or on what date to generate the report. If a virtual table of balances or a virtual table of information registers is selected in the query, then ACS automatically adds a parameter called "Period".

The main settings are made on the Settings tab.
Let's use the Settings Builder. Let's put the data in a list.

Select the required fields.

Grouping. Let's choose a grouping by nomenclature.

Sort by field Nomenclature in ascending order.

The result of the ACS setup is as follows.

On the "Parameters" tab for the "Period" parameter, set the "Include in user settings" flag. After after this setting, the parameters will be displayed in the main form of the report.

Let's save the report.
Formation of SKD.
Let's open the report in 1C:Enterprise. Set the desired period and generate a report.

Report generated!