Watching the weather is a very exciting activity. I decided to build my weather station based on the popular .
The weather station prototype looks like this:
Functions of my weather station:
- measurement and display of room and outdoor temperatures;
- display of the current time (hours and minutes);
- display of the current phases of the moon and lunar day;
- transfer of measurement results to a computer via a serial connection;
- transmission of measurement results by protocol MQTT using an application on a computer.
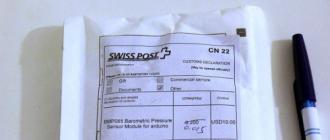
hex-file firmware for (version dated May 9, 2018) -
.
How to flash hex-file to board Arduino I have described.
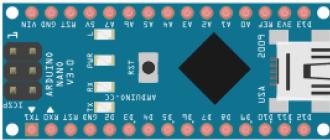
Microcontroller Arduino Nano 3.0
The "heart" of my weather station is the microcontroller eBay):
To control the indication and interrogation of sensors, I use timer 1 Arduino, causing interrupts with a frequency of 200 Hz (period - 5 ms).
Indicator
To display the measured readings of the sensors and the current time, I connected to Arduino four-digit LED indicator Foryard FYQ-5643BH with common anodes (anodes of identical segments of all discharges are combined).
The indicator contains four seven-segment digits and two separating (hour) dots: 
The anodes of the indicator are connected through current-limiting resistors to the terminals Arduino:
| discharge | 1 | 2 | 3 | 4 |
| conclusion | A3 | A2 | D3 | D9 |
Segment cathodes connected to pins Arduino:
| segment | a | b | c | d | e | f | g | p |
| conclusion | D7 | D12 | D4 | D5 | D6 | D11 | D8 | D13 |
The segment of the indicator lights up if the anode of the corresponding discharge has a high potential (1), and a low potential (0) at the cathode.
I use dynamic indication to display information on the indicator - only one digit is active at a time. Active discharges alternate at a frequency of 200 Hz (display period 5 ms). At the same time, the flickering of the segments is imperceptible to the eyes.
Temperature sensor DS18x20
For the possibility of remote temperature measurement, I connected a sensor , which provides a wide range of outside temperature measurements. The sensor is connected to the bus 1 wire and has three outputs - power ( VCC), data ( DAT), Earth ( GND):
| sensor output | VCC | DAT | GND |
| conclusion Arduino | 5V | A1 | GND |
Between pins VCC And DAT I included a 4.7 kΩ pull-up resistor.
To convert between degrees Celsius and Fahrenheit, you can use the following plate: 
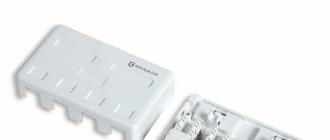
I placed the sensor outside the window of the house in a plastic case from a ballpoint pen:  \
\
Professional weather stations use a Stevenson screen to protect the thermometer from direct sunlight and allow air to circulate. stevenson screen):
Pressure and temperature sensor BMP280
Mercury and aneroid barometers are traditionally used to measure atmospheric pressure.
IN mercury barometer atmospheric pressure is balanced by the weight of the mercury column, the height of which is used to measure pressure: 
IN aneroid barometer compression and stretching of the box under atmospheric pressure is used: 
To measure atmospheric pressure and room temperature in my home weather station, I use a sensor - small smd- 2 x 2.5 mm sensor based on piezoresistive technology: 
A handkerchief with a sensor was purchased on the marketplace eBay:
The sensor is connected to the bus I2C(data contact - SDA/SDI, sync pin - SCL/SCK):
| sensor output | VCC | GND | SDI | SCK |
| conclusion Arduino | 3v3 | GND | A4 | A5 |
adafruit- files Adafruit_Sensor.h, Adafruit_BMP280.h, Adafruit_BMP280.cpp.
Atmospheric pressure units
Sensor via function readPressure gives the value of atmospheric pressure in pascals. The basic unit for measuring atmospheric pressure is hectopascal(hPa) (1 hPa = 100 Pa), whose analogue is the off-system unit " millibar" (mbar) (1 mbar = 100Pa = 1hPa). To convert between a commonly used non-systemic pressure unit " millimeter of mercury" (mm Hg) and hectopascals, the following ratios are used:
1 hPa = 0.75006 mmHg Art. ≈ 3/4 mm Hg; 1 mmHg =1.3332 hPa ≈ 4/3 hPa.
The dependence of atmospheric pressure on altitude above sea level
Atmospheric pressure can be represented in both absolute and relative form.
Absolute pressure QFE(English) absolute pressure) is the actual atmospheric pressure, without taking into account the correction above sea level.
Atmospheric pressure decreases by about 1 hPa with an increase in altitude of 1 m: 
The barometric formula allows you to determine the correction of barometer readings to obtain relative pressure (in mmHg):
$\Delta P = 760 \cdot (1 - (1 \over (10^ ( (0.0081350 \cdot H) \over (T + 0.00178308 \cdot H) ))))$ ,
where $T$ is the average air temperature on the Rankin scale, ° Ra, $H$ - height above sea level, feet.
Converting degrees Celsius to degrees Rankine:
$^(\circ)Ra = (^(\circ)C \cdot 1.8) + 491.67$
The barometric formula is used for barometric leveling - determination of heights (with an error of 0.1 - 0.5%). The formula does not take into account the humidity of the air and the change in the acceleration of free fall with height. For small height differences, this exponential dependence can be approximated with sufficient accuracy by a linear dependence.
Relative pressure QNH(English) relative pressure, Q-code Nautical Height) is the atmospheric pressure adjusted for mean sea level. Mean Sea Level, MSL) (For ISA and a temperature of 15 degrees Celsius), and is initially set taking into account the altitude at which the weather station is located. It can be found from the data of the weather service, the readings of calibrated instruments in public places, the airport (from reports METAR), from the Internet.
For example, for the nearby Gomel airport ( UMGG) I can see the actual weather report METAR at ru.allmetsat.com/metar-taf/russia.php?icao=UMGG :
UMGG 191800Z 16003MPS CAVOK M06/M15 Q1014 R28/CLRD//NOSIG ,
Where Q1014- pressure QNH at the airport is 1014 hPa.
History of bulletins METAR available from aviationwxchartsarchive.com/product/metar.
For normal relative air pressure QNH a pressure of 760 mm Hg is accepted. Art. or 1013.25 hPa (at a temperature of 0ºС, under a latitude of 45º of the Northern or Southern Hemisphere).
I set the pressure for the aneroid barometer QNH with the sensitivity adjustment screw: 
Weather forecast
Analysis of pressure changes allows you to build a weather forecast, and its accuracy is the higher, the more abruptly the pressure changes. For example, an old navigator's rule of thumb is that a pressure drop of 10 hPa (7.5 mmHg) over an 8-hour period means strong winds are on the way.
Where does the wind come from? Air flows to the center of the low pressure area, wind- horizontal movement of air from areas of high pressure to areas of low pressure (high atmospheric pressure squeezes air masses into an area of low atmospheric pressure). If the pressure is very low, the wind can reach storm. At the same time, in the area reduced pressure (baric depression or cyclone), warm air rises and forms clouds, which often bring rain or snow.
The wind direction in meteorology is the direction from which the wind is blowing: 
This direction is reduced to eight points.
An algorithm is often used to predict weather based on atmospheric pressure and wind direction. Zambretti.
Humidity sensor
To determine the relative humidity of the air, I use the module DHT11(purchased from marketplace eBay):

Humidity sensor DHT11 has three outputs - power ( + ), data ( out), Earth ( - ):
| sensor output | + | out | - |
| conclusion Arduino | 5V | D10 | GND |
To work with the sensor, I use the library from adafruit- files DHT.h, DHT.cpp.
Humidity characterizes the amount of water vapor contained in the air. Relative Humidity shows the proportion of moisture in the air (as a percentage) in relation to the maximum possible amount at the current temperature. Used to measure relative humidity :
For a person, the optimal range of air humidity is 40 ... 60%.
Real time clock
As a real time clock, I applied the module RTC DS1302(a handkerchief with a watch was purchased on the marketplace eBay):

Module DS1302 connected to the bus 3 wire. To use this module with Arduino library developed arduino_RTC( from iarduino.ru).
Board with module DS1302 has five pins that I connected to the pins of the board Arduino Nano:
| conclusion RTC | VCC | GND | RST | CLK | DAT |
| conclusion Arduino | 5V | GND | D2 | D1 | D0 |
To keep the correct clock readings when the power is off, I inserted a battery into the socket on the board. CR2032.
The accuracy of my clock module was not very high - the clock is faster by about one minute in four days. Therefore, I reset the minutes to "zero" and the hour to the nearest by holding the button connected to the Arduino's A0 pin after turning on the power of the weather station. After initialization, pin A0 is used to transfer data through the serial connection.
Transferring data to a computer and working via the MQTT protocol
To transfer data via a serial connection to Arduino connects USB-UART converter:
Conclusion Arduino used to transfer data in the format 8N1(8 data bits, no parity, 1 stop bit) at 9600 bps. Data is transmitted in packets, and the packet length is 4 characters. Data transfer is carried out in " bit bang" mode, without using the hardware serial port Arduino.
Format of transmitted data:
| Parameter | 1st byte | 2nd byte | 3rd byte | 4th byte |
| outdoor temperature | o | space or minus | tens of degrees or space | units of degrees |
| room temperature | i | space or minus | tens of degrees or space | units of degrees |
| Atmosphere pressure | p | hundreds of mm Art. | tens of mm Hg | units mmHg With. |
| relative humidity | h | space | tens of percent or space | percent units |
| current time | dozens of hours | units of hours | tens of minutes | units of minutes |
MQTT
golang application - protocol client MQTT, which sends the information received from the weather station to the server ( MQTT-broker) :![]()
Service allows you to create an account with a free plan " " (limits: 10 connections, 10 Kbps): 
To monitor the readings of the weather station, you can use Android-application :
Nutrition
To power the weather station, I use a charger from an old mobile phone. Motorola, outputting a voltage of 5 V with a current of up to 0.55 A and connected to the contacts 5V(+) and GND (-):
You can also use a 9 V battery for power, connected to the contacts VIN(+) and GND (-).
Weather station operation
At startup, the sensors are initialized and checked.
In the absence of a sensor DS18x20 an error "E1" is issued, if there is no sensor - error "E3".
Then the work cycle of the weather station is started:
- measurement and display of outside temperature;
- measurement and display of room temperature;
- measurement and display of atmospheric pressure and the trend of its change;
- measurement and display of relative air humidity;
- display of the current time;
- display of the phase of the moon and the lunar day.

A video of my weather station is available on my -channel: https://youtu.be/vVLbirO-FVU
Temperature display
When measuring temperature, two digits of temperature are displayed and for a negative temperature, a minus sign (with a degree symbol in the rightmost digit);
for outdoor temperature, the degree sign is displayed at the top: 

for room temperature - below: 
Pressure display
When measuring pressure, three digits of pressure are displayed in mmHg (with the symbol " P" in the far right digit): 
If the pressure dropped sharply, then instead of the symbol " P" the character " is displayed in the far right digit L"if it has grown sharply - then" H". The criterion for the sharpness of the change is 8 mm Hg in 8 hours: 
Since my weather station displays absolute pressure ( QFE), then the readings turn out to be somewhat underestimated compared to the information in the summary METAR(which provides QNH) (14 UTC March 28, 2018):
The pressure ratio (according to ATIS) was $(1015 \over 998) = $1.017. Elevation of Gomel airport (ICAO code UMGG) above sea level is 143.6 m. The temperature according to ATIS was 1 ° C.
The readings of my weather station almost coincided with the absolute pressure QFE according to ATIS!
Max/min pressure ( QFE) recorded by my weather station for the entire observation period:
Relative humidity display
Relative air humidity is displayed as a percentage (the percent symbol is displayed in the two right-hand digits): 
Current time display
The current time is displayed on the indicator in the "HH:MM" format, with the separating colon flashing once per second: 
Display of phases of the moon and lunar day
The first two digits of the indicator display the current lunar phase, and the next two - the current lunar day: 
The Moon has eight phases (English and Russian (blue - inaccurate) names are given): 
On the phase indicator are displayed by pictograms:
| phase | pictogram |
 |
|
| growing sickle (crescent) |  |
 |
|
 |
|
 |
|
 |
|
 |
|
| waning crescent (crescent) |  |
Transferring data to a computer
If you connect the weather station with USB-UART converter (for example, based on a microcircuit CP2102) connected to USB-port of the computer, then you can use the terminal program to observe the data transmitted by the weather station: ![]()
I developed in a programming language golang a program that keeps a log of meteorological observations and sends data to the service and can be viewed on Android-smartphone using the application :
According to the log of meteorological observations, you can, for example, build a graph of changes in atmospheric pressure:
example of a graph with a noticeable pressure minimum 
example of a graph with a slight increase in pressure 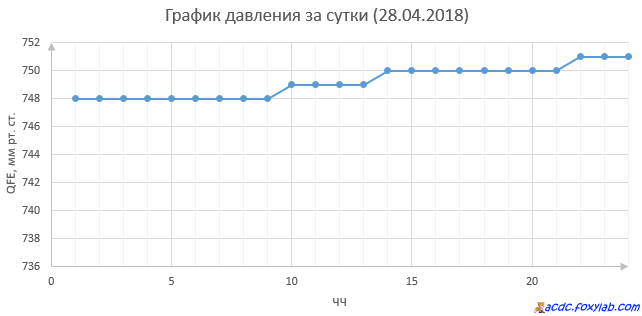
Planned improvements:
- adding wind direction and speed sensors
In weather stations, a three-cup anemometer (1) is used to measure wind speed, and a weather vane (2) is used to determine the direction of the wind:

Also used to measure wind speed. filament hot-wire anemometers(English) hot wire anemometer). As a heated wire, you can use a tungsten filament from a light bulb with broken glass. In industrial hot-wire anemometers, the sensor is usually located on a telescopic tube:
The principle of operation of this device is that heat is removed from the heating element due to convection by an air flow - wind. In this case, the resistance of the filament is determined by the temperature of the filament. The law of change in the resistance of the filament $R_T$ from temperature $T$ has the form:
$R_T = R_0 \cdot (1 + (\alpha \cdot (T - T_0)))$ ,
where $R_0$ is the filament resistance at temperature $T_0$, $\alpha$ is the temperature coefficient of resistance (for tungsten $\alpha = 4.5\cdot(10^(-3) (^(\circ)(C^( -1))))$).
With a change in the speed of the air flow, the temperature changes at a constant filament current (an anemometer with direct current, eng. CCA). If the temperature of the heating element is kept constant, then the current through the element will be proportional to the speed of the air flow (constant temperature anemometer, eng. CTA).
To be continued
November is a month of incomprehensible weather: the sun shone in the morning, and by lunchtime everything outside the window is already white with snow. The good old weather station on the Arduino will help keep track of all this weather rigmarole. Get inspired by our selection of the coolest homemade weather stations and build your own to always be ready for the surprises of nature and not literally sit in a puddle.
bluetooth weather lamp
The control device surfs the web in search of weather information and sends signals via Bluetooth to a servo motor in the lamp, which changes pictures depending on the forecast. A simple and stylish weather station that can decorate your interior.
Here the principle is approximately the same as in the previous project, but the executing device is made in the form of a cloud, which changes color depending on the temperature, and the servomotor indicates whether it is warm outside or cold. This funny mini station will look great on your desktop.
For those who like more clouds, there is another option
Vintage weather station

Lovers of vintage gizmos and experienced steampunkers will be able to appreciate the weather station in the form of an old clock.
Twitter weather

This nondescript wooden pyramid is actually a high-tech weather station that can measure temperature, air humidity, pressure, light levels, CO levels and send all the data to you on Twitter.
Tempescope
Tempescope is the kind of thing you can use to bring the rain home. Or fog. Or even a thunderstorm. And they will live there. Now you don’t even have to look out the window to know what Mother Nature has prepared for you today.
Cuba weather
You can not only see the weather forecast, but also feel it. This steel Cryoscope cube, guided by data from the network, heats up or cools down to the temperature outside. You lean this one a little lower than the coccyx, and it’s immediately clear whether you need to put on underpants today or not.
In my free time, and this time I wrote instructions for making a small weather station. It will function as a clock with a date and show the temperatures inside and outside the room. We will use an Arduino UNO as the main controller, but another board with an Atmega328p on board will do. For display, we use the WG12864B graphic screen. We will also connect two ds18b20 temperature sensors. One is indoors, the other is taken outside. Let's start.
In the process of making homemade products, we need:
Arduino UNO (Or any other Arduino compatible board)
- WG12864B graphic screen
- ds18b20 temperature sensor, 2 pcs
- Power supply 6 - 12 V
- Resistors 4.7 Kom 0.25 W, 2 pcs.
- Resistors 100 ohm 0.25 W
- Battery compartment for 4 AAA "little finger" batteries
- Box from the SEGA console cartridge
- Insulating tape
- Connecting wires
- Circuit board
- Buttons
- Stationery knife
- soldering iron
- Solder, rosin
- Double sided tape
Step 1 Prepare WG12864B3.
Those who have not worked with screens before may be intimidated by the large number of modifications to seemingly identical screens. I'll explain a little. Most screens of this type work on ks0107/ks0108 chips. All screens can be divided into 4 types:
Option A: HDM64GS12L-4, Crystalfontz CFAG12864B, Sparkfun LCD-00710CM, NKC Electronics LCD-0022, WinStar WG12864B-TML-T
Option B: HDM64GS12L-5, Lumex LCM-S12864GSF, Futurlec BLUE128X64LCD, AZ Displays AGM1264F, Displaytech 64128A BC, Adafruit GLCD, DataVision DG12864-88, Topway LM12864LDW, Digitron SG12864J4, QY-1286 4F, TM12864L-2, 12864J-1
Option C: Shenzhen Jinghua Displays Co Ltd. JM12864
Option D: Wintek- Cascades WD-G1906G, Wintek - GEN/WD-G1906G/KS0108B, Wintek/WD-G1906G/S6B0108A, TECDIS/Y19061/HD61202, Varitronix/MGLS19264/HD61202
They look almost the same. But the connection pins are different. I chose, and I recommend to you, WG12864B3 V2.0, but if the screen came in a different one, or you just don’t have it at hand, you can easily figure it out using the table:
Brief specifications:

There are many different connection schemes on the Internet, and everything seems to work. The thing is that there are not only different screens, but also two ways to connect them: serial and parallel. When using a serial port connection, we need only 3 microcontroller outputs. With a parallel minimum of 13. The choice in this case is obvious, the Arduino does not have many conclusions anyway. For parallel connection, the connection diagram is as follows:

For a serial connection, which we will use, the scheme is as follows:
WG12864B - Arduino UNO 1 (GND) - GND 2 (VCC) - +5V 4 (RS) - 10 5 (R/W) - 11 6 (E) - 13 15 (PSB) - GND 19 (BLA) - via resistor 100 Ohm - +5V 20 (BLK) - GND
To adjust the contrast, a potentiometer must be on the screen. There are screens without it, but this is now rare:

A 100 ohm resistor is needed so that a voltage of 5 volts does not accidentally burn the backlight diodes.

Step 2 Making the case.
For the case, take the box from the cartridge of the Sega set-top box. If you do not find this box at hand, you can use another case. The main thing is that the screen and Arduino fit in it.

Cut off the transparent film, on top of the box, so that there are no pieces left:

Then, using a clerical knife, cut out a 37x69 window for the screen.

On the reverse side, along the edge of the cutout, we glue double-sided tape, preferably black:

We remove the protective paper from the adhesive tape, and glue our screen on it:

From the outside it should look like this:

Below the screen, also on double-sided tape, we mount the Arduino, having previously made cutouts for the USB port and the power socket:

Cutouts for the Arduino sockets must be made on both sides of the box so that it can close freely:

Step 3 Temperature sensors.
We will use DS18B20 digital temperature sensors. Using them, we obtain greater measurement accuracy, an error of not more than 0.5 °C, in a wide temperature range of -55 ... + 125 °C. In addition, the sensor is digital and performs all the calculations itself, and the Arduino simply receives ready-made readings. When connecting this sensor, do not forget about the 4.7KΩ pull-up resistor between the DQ and VDD pins. Several connection options are also possible. With external power, in my opinion the best option, we will use it:


With any power supply, the sensors are connected in parallel:

We will place the indoor temperature sensor on a small board along with two buttons that we will use to set the time and date of the clock:

We connect the common wire from both buttons to GND, connect the wire from the first button to A0, from the second to A1.
We fix it on double-sided tape next to the Arduino:

The sensor, which is supposed to be placed outside the room, is better to choose in a metal, dust-proof housing:

Calculate the wire of the required length so that you can hang the sensor outside the window, the main thing is that it should not be more than 5 meters, if you need a longer length, you will need to reduce the value of the pull-up resistor.
We connect the wire from the DQ data bus of both sensors to pin 5 of the Arduino.
Vdd - +5 Arduino.
GND - GND Arduino.
Step 4 Nutrition.
For power, you can use a power supply with a voltage of 6 to 12 volts. At the end of the power flare wire, solder a plug that fits the Arduino power socket:

Or you can put a battery compartment for four "AAA", "little finger" batteries into the case. And connect the positive wire from the bay to Vin Arduino, and the negative wire to GND.
Step 5 Prepare the programming environment.
First you need to download and install the Arduino IDE from the official website
And also add to the two libraries needed for the sketch. OneWire - required for communication with ds18b20 sensors:
U8glib - used to display information on the screen:
Downloading libraries. Then we unpack the archives, and move the contents of the archives to the "libraries" folder, located in the folder with the installed Arduino IDE. You can also add libraries through the Arduino IDE. To do this, without unpacking the archives, run the Arduino IDE, select Sketch - Connect Library from the menu. At the very top of the drop-down list, select the "Add. Zip Library" item. Specify the location of the downloaded archives. After all the steps, you need to restart the Arduino IDE.
Step 6 Editing the sketch.
Temperature sensors work using the One Wire protocol and have a unique address for each device - a 64-bit code. It is not advisable to add commands to search for sensors in the sketch. There is no need to load the Arduino every time to hiccup sensors. Therefore, first, having collected everything together, we fill in the Arduino sketch, located in the menu File - Examples - Dallas Temperature - OneWireSearch. Then we launch Tools - Port Monitor. Arduino should find our sensors, write addresses and temperature readings. These addresses must be written down or simply copied somewhere. Now open the Ard_Tic_Tak_WG12864B_2_x_Term_Serial sketch and look for the lines:
Byte addr1=(0x28, 0xFF, 0x75, 0x4E, 0x87, 0x16, 0x5, 0x63);// address of internal byte addr2=(0x28, 0xFF, 0xDD, 0x14, 0xB4, 0x16, 0x5, 0x97); sensor
We replace the addresses of the sensors corresponding to the location with our addresses.
Our clock does not use the RTC module (real time clock), so it is necessary to correct the clock. For convenience, uncomment the line (seconds will appear on the screen):
//u8g.setPrintPos(44, 50); u8g.print(sec); // Output seconds to control the correctness of the move
Set the correct time using the port monitor. To do this, open the port monitor, wait for the initial temperature measurements to finish, and enter the current date and time in the format "day, month, year, hours, minutes, seconds". No spaces, numbers are separated by commas or dots.
If the clock is in a hurry, change the value to a larger one, I recommend experimenting with a step of 100 units. If lagging behind should decrease the value in the line:
If (micros() - prevmicros >494000) ( // change to something else to adjust it was 500000
Empirically, we determine the number at which the clock runs accurately enough. To determine the accuracy of the move, you need the output of seconds. After precise calibration of the number, seconds can be commented out and thus removed from the screen.
Uploading the sketch.
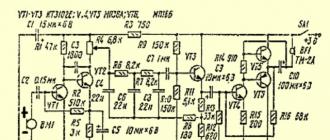
Somehow, while walking around the city, I saw a new radio electronics store that had opened. Going into it, I found a large number of shields for Arduino. I had an Arduino Uno and an Arduino Nano at home and I immediately got the idea to play around with signal transmitters from a distance. I decided to buy the cheapest transmitter and receiver at 433 MHz:
Signal transmitter.

signal receiver.
Having recorded the simplest sketch of data transmission (an example is taken from here), it turned out that transmitting devices can be quite suitable for transmitting simple data, such as temperature, humidity.
The transmitter has the following characteristics:
1. Model: MX-FS-03V
2. Radius of action (depends on the presence of blocking objects): 20-200 meters
3. Working voltage: 3.5 -12V
4. Module dimensions: 19*19mm
5. Signal modulation: AM
6. Transmitter power: 10mW
7. Frequency: 433MHz
8. Required length of external antenna: 25cm
9. Easy to connect (only three wires): DATA ; VCC ; Earth.
Receiving module characteristics:
1. Working voltage: DC 5V
2. Current: 4mA
3. Working frequency: 433.92MHz
4. Sensitivity: - 105dB
5. Module dimensions: 30*14*7mm
6. External antenna required: 32 cm.
In the vastness of the Internet it is said that the range of information transmission at 2Kb / s can reach up to 150m. I did not check it myself, but in a two-room apartment it accepts everywhere.
Home weather station hardware
After several experiments, I decided to connect a temperature, humidity sensor and a transmitter to the Arduino Nano.

The temperature sensor DS18D20 is connected to the arduino as follows:

1) GND to the minus of the microcontroller.
2) DQ through a pull-up resistor to ground and to Arduino's D2 pin
3) Vdd to +5V.
The transmitter module MX -FS - 03V is powered by 5 Volts, the data output (ADATA) is connected to the D13 pin.
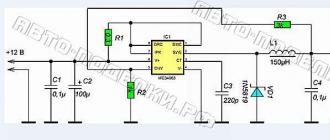
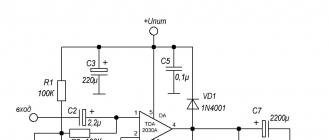
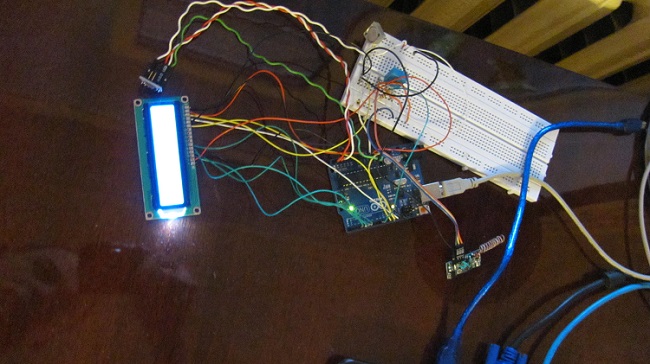
I connected an LCD display and a BMP085 barometer to Arduino Uno.

wiring diagram for arduino uno
The signal receiver is connected to pin D10.
The BMP085 module is a digital atmospheric pressure sensor. The sensor allows you to measure temperature, pressure and altitude. Connection interface: I2C. Sensor supply voltage 1.8-3.6 V
The module is connected to the Arduino in the same way as other I2C devices:
- VCC - VCC (3.3V);
- GND-GND;
- SCL - to analog pin 5;
- SDA - to analog pin 4.
- Very low cost
- Power and I/O 3-5V
- Determination of humidity 20-80% with 5% accuracy
- Determination of temperature 0-50 degrees. with 2% accuracy
- Polling frequency no more than 1 Hz (no more than once every 1 sec.)
- Dimensions 15.5mm x 12mm x 5.5mm
- 4 pins with 0.1" leg spacing
DHT has 4 pins:
- Vcc (3-5V supply)
- Data out - Data output
- Not used
- General
Connects to D8 Arduino.

Home weather station software
The transmitter module measures and transmits the temperature every 10 minutes.
Below is the program:
/* Sketch version 1.0 Send temperature every 10 min. */ #include #include #include #define ONE_WIRE_BUS 2 //Pin for connecting Dallas sensor OneWire oneWire(ONE_WIRE_BUS); DallasTemperature sensors(&oneWire); DeviceAddress insideThermometer; void setup(void) ( //Serial.begin(9600); vw_set_ptt_inverted(true); // Required for DR3100 vw_setup(2000); // Set baud rate (bps) sensors.begin(); if (!sensors .getAddress(insideThermometer, 0)); printAddress(insideThermometer); sensors.setResolution(insideThermometer, 9); ) void printTemperature(DeviceAddress deviceAddress) ( float tempC = sensors.getTempC(deviceAddress); //Serial.print("Temp C : "); //Serial.println(tempC); //Formation of data for sending int number = tempC; char symbol = "c"; //Service symbol for determining that this is a sensor String strMsg = "z "; strMsg += symbol; strMsg += " "; strMsg += number; strMsg += " "; char msg; strMsg.toCharArray(msg, 255); vw_send((uint8_t *)msg, strlen(msg)); vw_wait_tx(); / / Wait for the transfer to complete delay(200); ) void loop(void) ( for (int j=0; j<= 6; j++) { sensors.requestTemperatures(); printTemperature(insideThermometer); delay(600000); } } //Определение адреса void printAddress(DeviceAddress deviceAddress) { for (uint8_t i = 0; i < 8; i++) { if (deviceAddress[i] < 16); //Serial.print("0"); //Serial.print(deviceAddress[i], HEX); } }
The receiving device receives data, measures the pressure and temperature in the room and transmits it to the display.
#include #include LiquidCrystal lcd(12, 10, 5, 4, 3, 2); #include dht11 sensor; #define DHT11PIN 8 #include #include BMP085 dps = BMP085(); long Temperature = 0, Pressure = 0, Altitude = 0; void setup() ( Serial.begin(9600); vw_set_ptt_inverted(true); // Required for DR3100 vw_setup(2000); // Set receive rate vw_rx_start(); // Start air monitoring lcd.begin(16, 2); Wire.begin(); delay(1000); dps.init(); //lcd.setCursor(14,0); //lcd.write(byte(0)); //lcd.home(); ) void loop() ( uint8_t buf; // Message buffer uint8_t buflen = VW_MAX_MESSAGE_LEN; // Buffer length if (vw_get_message(buf, &buflen)) // If a message is received ( // Start parsing int i; // If the message is not addressed to us , exit if (buf != "z") ( return; ) char command = buf; // Command is at index 2 // Numeric parameter starts at index 4 i = 4; int number = 0; // Since the transfer is character by character , then you need to convert the character set to a number while (buf[i] != " ") ( number *= 10; number += buf[i] - "0"; i++; ) dps.getPressure(&Pressure); dps.getAltitude (&Altitude); dps.getTemperature(&Temperature); //Serial.print(command); Serial.print(" "); Serial.println(number); lcd.print("T="); lcd.setCursor(2,0); lcd print(number); lcd.setCursor(5,0); lcd.print("P="); lcd.print(Pressure/133.3); lcd.print("mmH"); lcd.setCursor(0,1); lcd.print("T="); lcd.print(Temperature*0.1); lcd.print("H="); lcd.print(sensor.humidity); lcd.home(); //delay(2000); int chk = sensor.read(DHT11PIN); switch (chk) ( case DHTLIB_OK: //Serial.println("OK"); break; case DHTLIB_ERROR_CHECKSUM: //Serial.println("Checksum error"); break; case DHTLIB_ERROR_TIMEOUT: //Serial.println("Time out error"); break; default: //Serial.println("Unknown error"); break; ) ) )
P.S. In the future, I plan to add the following:
- humidity sensor to the transmitter, rework the data transmission algorithm
- sensor for measuring wind speed and direction.
- add another display to the receiver.
- transfer the receiver and transmitter to a separate microcontroller.
Below is a photo of what happened:

List of radio elements
| Designation | Type | Denomination | Quantity | Note | Shop | My notepad | |
|---|---|---|---|---|---|---|---|
| transmitting part. | |||||||
| Arduino board | Arduino Nano 3.0 | 1 | To notepad | ||||
| temperature sensor | DS18B20 | 1 | To notepad | ||||
| Resistor | 220 ohm | 1 | To notepad | ||||
| transmitter module | MX-FS-03V (433 MHz) | 1 | To notepad | ||||
| radio receiving part. | |||||||
| Arduino board | Arduino Uno | 1 | To notepad | ||||
| Trimmer resistor | 1 | To notepad | |||||
| Resistor | |||||||
“So, let's agree right away: you are not going to make a movie for Hollywood. Even in Wonderland, no more than five percent of all scripts are approved, and only one percent then goes into production ... So, instead of all this, you are going to create your own Hollywood. ”
Ed Gaskel "Shooting digital cinema, or Hollywood at home"
Foreword
What, another Arduino weather station?! Yes, one more and, something tells me, not the last one in the Internet of things.
Just as every programmer is required to write a “Hello World!” program, so every arduinian must have experience in building a simple or not very weather station.
A considerable number of already created projects of weather stations on the Internet are described, the reader can choose any of them for implementation. Frankly, I carefully studied about a dozen similar projects and a bunch of related ones. Therefore, it cannot be said that I created everything from scratch, of course I "stood on the shoulders of giants."
I must say right away that my plans did not include the use of third-party services for storing and displaying data. I wanted to personally feel and understand how it all works from the inside from beginning to end, from A to Z.
So for those who want to quickly rivet something out of nothing, this series of articles is most likely not suitable. It's easier to go and buy a ready-made kit with assembly instructions. Microelectronics professionals have absolutely nothing to do here, maybe neighing and remember themselves at the beginning of the journey.
But for those who really want to understand, I think they will like it. Perhaps the material will be useful as a teaching aid.
This project was implemented back in 2016, but I hope it is still relevant.
Technology set
We will study and work with simple and complex things:
- temperature and humidity sensors type DHT22, DHT11
- barometric pressure sensor type BMP180
- WiFi module ESP8266
- radio module type nRF24 2.4 GHz
- family Arduino Pro Mini, Arduino Mega
- solar panels and batteries
- programming language C/C++
- PHP programming language
- MySQL database management system
- the Java programming language and the Android framework (creating an application for Adnroid to display weather data on a smartphone).
Some of the topics listed are not worth a damn, and some can be studied for years. Therefore, we will touch on complex things only in the part directly related to this project, so that you understand how it all works.
But we'll start from the very beginning Right. Namely, from the description and design of the future device "on paper" so that in the end each brick lay in its place.
prototyping
As Wikipedia correctly tells us, prototyping is a quick draft implementation of a working system. Which, yes, will not work completely inefficiently and with some errors, but will give an idea of whether the craft should be developed to an industrial design. The process of creating a prototype should not be long. The prototyping stage is followed by the analysis of the system and its refinement.
But this is in an industry where workers are employed full time.
Everyone who rivets their pet-project crafts for the “internet of things” in the evenings should be aware that they are creating a prototype, a semi-finished product. It is very far from the level of a normal industrial product. That's why you should not entrust our amateur crafts with any critical life support areas and hope they don't let us down.
An industrial product is built on an industrial element base and then goes through many more stages, including debugging, testing and maintenance, before it becomes a bestseller.
So, instead of all this tedium, we will create our own toy, but not a simple one. With elements of technical creativity, the beginnings of programming and knowledge (in the process of creation) of many other related things.
Of course, electronics engineers will have a hard time at the programming stage, and programmers will have to sweat over circuitry, but the author will try to state everything as accessible as possible and clearly describe why certain solutions were used.
Requirements
Usually this step is skipped. Deciding to do something like this right now, and then it turns out small details that put the whole project in a dead end or even make it unbearable. All our Wishlist needs to be recorded, I use Google Drive for this, it is available from a PC and from a mobile device.
So, our weather station should:
- measure temperature and humidity outside
- measure the temperature and humidity in the house
- measure atmospheric pressure
- display the indicated values on the display
- transfer data to a server on the Internet, where the data will be stored in a database and displayed on a web page, or used in a mobile application.
Sensors are used the simplest and cheapest. For example, looking ahead, I’ll say that the DHT22 measures temperature quite accurately, but it’s a little inaccurate with humidity. But, again, I repeat, it does not matter, because we have a prototype in front of us, and a spread of 5% humidity will not affect anything important in our life.
The system architecture, hardware and software must allow the system to be further extensible to add new sensors and new capabilities.
Iron. Component Selection
This is the most important part, and not soldering or programming at all. After defining the requirements for the system, it is necessary to decide with the help of what exactly they will be implemented.
Here there is one nuance. To select components, you need to know their capabilities well, you need to know the technologies themselves. That is, in other words, here you need to be far from a beginner electronics engineer and programmer. So what now to spend a couple of years studying the whole range of possible devices?
Vicious circle? But vicious circles exist in order to break them.
There is an exit. You can just take and repeat someone's project. I studied the already existing projects of weather stations and I hope I took a step forward.
So. The architecture of the weather station is based on the Arduino. Because Arduino has a small threshold of entry and I have already dealt with this. Then it's easier to choose.
It immediately became clear that the weather station would include a remote, out-of-window sensor and a central module.
The central, main unit will be located indoors. It is important to determine this at the initial stage; such important characteristics as the temperature regime of operation and power “dance” from this.
The remote sensor (or sensors) will be without "brains", its task is to periodically take measurements and transmit data to the central home unit. The central unit receives data from all sensors, displays them on the screen and sends them to the Internet to the database. Well, it’s already much easier there, as soon as the data is in the database, you can do whatever you want with it, even draw graphs.
For communication with the outside world, the Internet was unequivocally chosen by the ESP8266 WiFi module with almost no alternative (note, perhaps now such alternatives have appeared). Ethernet expansion boards are available for Arduino, but I didn’t want to be tied to a cable at all.

An interesting question was how to provide communication between the outside sensor (or sensors, remember about the requirement for system expandability?) and the center. 433 MHz radio beacons are definitely not suitable (they are not suitable for anything at all).
Use ESP8266 again?
Cons of this solution:
Requires stable WiFi outside the home
communication range will not be great
reliability will suffer, if the Internet fails, we will not see our remote sensors
more power consumption.
Power Consumption ESP8266:
when transmitting 120-170 mA
when receiving 50-56 mA
in Deep Sleep mode 10 µA (µA)
off state 5 µA (µA).
In the end, to connect remote sensors with the main home unit, the nRF24L01 + chip with a 2.4 GHz transmitter and receiver in one bottle was chosen, with an additional external antenna, to certainly “break through” the walls.

Power consumption nRF24L01+ 2.4 GHz:
- when receiving 11 mA
- when transmitting at a speed of 2Mbps - 13 mA
- in standby-I mode - 26 μA (μA)
- off state 900 nA (nA).
Both the ESP8266 and the nRF24L01+ have a suitable operating temperature range: from -40℃ to +80℃.
You can buy the nRF24L01+ for about $1, or with an external antenna for $3. You can buy ESP8266-01 for about $4. Read the product description carefully! Otherwise, buy one antenna.
The core of the system emerged. Let's move on to the sensors themselves.
On the street, as you know, the temperature can reach negative values, so the DHT11 sensor is not suitable, but the DHT22 is just right.

Specifications of DHT22 / AM2302:
- 3.3V to 5V supply, 5V recommended
- consumption 2.5mA maximum, at the time of measurement and data transfer
- humidity measurement range 0-100% with an error of 2-5%
- temperature measurement range from -40 to +125°C with an error of ±0.5°C
- request for measurement no more than 0.5 Hz - once every 2 seconds.
Inside the house, I hope there will be no negative temperatures, so you can use DHT11, especially since I already had it.
Features of DHT11:
- 3.3V to 5V supply
- consumption 2.5 mA maximum, at the time of measurement and data transfer
- humidity measurement range 20-80% with an error of 5%
- temperature measurement range from 0 to +50°C with an error of ±2°C
- measurement request no more than 1 Hz - once per second.
You can buy DHT22 for about $3. DHT11 costs less - $1, but it is also less accurate.
Now back to the Arduino again. Which board to choose?
I tested individual parts of the system on the Arduino UNO. Those. I connected the ESP module to the uno and studied it, turned it off, then connected the nRF24, etc. For the final implementation of the window sensor, I chose the Arduino Pro Mini as the closest miniature to the Uno.

In terms of power consumption, the Arduino Pro Mini also looks good:
- there is no USB-TTL converter, which itself "eats" a lot,
- The LED is connected through a 10k resistor.
For advanced energy conservation, it was planned:
- remove the LED - power indicator on the Arduino Pro Mini (I regretted not spoiling the board)
- or use a "bare" assembly on an Atmel ATmega328 microprocessor (did not use it)
- use the Low Power Library or JeeLib .
From the libraries I chose Low Power Library, it is simple and contains only what you need.
For the central unit, since it was planned to connect numerous peripherals to it, the Arduino Mega board was chosen. In addition, it is fully compatible with UNO and has more memory. Looking ahead, I will say that this choice was fully justified.
You can buy Arduino Mega for about $8.
Power and power consumption
Now about food and power consumption.
There are two types of Arduino Pro Mini:
- for supply voltage 5V and frequency 16MHz
- for a supply voltage of 3.3V and a frequency of 8MHz.
Since the nRF24L01+ radio module requires 3.3V for power supply, and speed is not important here, buy an Arduino Pro Mini at 8MHz and 3.3V.
In this case, the supply voltage range of the Arduino Pro Mini is:
- 3.35-12V for 3.3V model
- 5-12V for 5V model.
I already had a 5V Arduino Pro Mini, which is why I used it. You can buy an Arduino Pro Mini for about $4.
The power supply of the central unit will be from the 220 V network through a small power supply unit, giving an output of 12V, 450mA, 5W. Something like this for $5. There is also a separate output for 5V.

And if this is not enough, then you can put it more powerfully. In other words, saving power for the central unit does not make much sense. But for a remote wireless sensor, energy saving is the most important part. But I don't want to lose functionality either.
Therefore, the Arduino Pro Mini and the nRF24 radio module will be powered by a bundle of 4 Ni-Mh batteries.
And remember maximum capacity of a modern battery about 2500-2700mAh, anything more is either a marketing gimmick (Ansmann 2850) or a hoax (UltraFire 3500).
I do not use Li-Ion batteries for several reasons:
- very expensive
- when the ambient temperature drops below 0°C, the power of the lithium-ion battery decreases to 40-50%
- those that are cheap are made without protection and are unsafe (during a short circuit or discharge, they can explode and burn, see a bunch of videos on YouTube)
- grow old, even if they are not used (however, this can be said about all chemical elements), after 2 years a Li-Ion battery loses about 20% of its capacity.
For a prototype, it is quite possible to get by with high-quality Ni-MH AA or AAA batteries. Moreover, we do not need large currents. The only disadvantage of Ni-MH batteries is their long charging time.
General scheme of the weather station
Let's summarize. Here is a general diagram of how it all works.
To be continued.