This short note aims to show how you can configure the system in order to get an emergency windows memory dump, that is, a dump that can be generated in the event of a critical crash characterized by the appearance of a blue screen of death (BSOD). What is a dump in general, why do we need it and what is it, what problems is it intended to solve and what information does it contain?
Memory dump - the contents of the working memory of a process, kernel, or the entire operating system, including, in addition to working areas, additional information about the state of processor registers, the contents of the stack, and other service structures.
Why we may need this content, that is windows memory dump? Perhaps most often, a memory dump is used to investigate the causes of a system failure (), which caused a complete shutdown of the operating system. In addition to this, memory state can be used for other purposes. It is also important that a memory dump is literally the only way to get information about any failure! And taking (obtaining) a system memory dump is, in fact, the only accurate method of obtaining a snapshot (copy) of the contents of the physical memory of the system.
The more accurately the contents of the dump will reflect the state of memory at the time of the failure, the more detailed we can analyze the emergency situation. Therefore, it is extremely important to get exactly an up-to-date copy of the physical memory of the system at a strictly defined point in time immediately preceding the failure. And the only way to do this is to create a complete crash dump. The reason is quite trivial - when an emergency memory dump of the system occurs, whether as a result of a failure, or as a result of an artificially simulated situation, the system at this moment of receiving control of emergency functions (KeBugCheckEx) is in an absolutely unchanged (static) state, therefore, between the moment of the failure and the moment the data is written to the medium, nothing changes the contents of the physical memory, and it is written to disk in its original state. Well, this is in theory, but in real life it is rare, but there are situations that due to faulty hardware components, the memory dump itself may be damaged, or the station may freeze during the dump recording process.
In the overwhelming majority of cases, from the moment the crash dump process begins, until the moment the memory contents are written to disk, the information in memory remains unchanged.
Theoretically, the static (immutability) of the memory footprint is explained by the fact that when the KeBugCheckEx function is called, which displays information about the crash and starts the process of creating a memory dump, the system is already completely stopped and the contents of physical memory are written to blocks occupied by the paging file on the disk. after which, already in the process of the subsequent loading of the operating system, it is dumped into a file on the system media. Well, almost once I observed a situation when a failed motherboard did not allow saving a memory dump: a) freezing during the operation of the dump saving logic (the process did not reach 100%), b) damaging the memory dump file (the debugger was cursing at structures), c ) by writing zero-length memory.dmp dump files. Therefore, in spite of the fact that the system at the time of creating a memory dump is already completely stopped, and only the emergency code works, the faulty hardware can make its own adjustments to any logic without exception at any stage of operation.
Traditionally, disk blocks allocated to the pagefile are used initially to save a Windows memory dump. Then, after a blue screen and a reboot, the data is moved to a separate file, and then the file is renamed according to a pattern depending on the type of dump. However, starting from the version of Windows Vista, this state of affairs can be changed, now the user is given the opportunity to save a dedicated dump without the participation of the paging file, putting information about the failure in a temporary file. This was done in order to eliminate configuration errors associated with incorrect setting of the size and position of the paging file, which often led to problems during the process of saving the memory dump.
Let's see what kinds of dumps the Windows operating system allows us to create:
- Memory dump of the process (application);
- Kernel memory dump;
- Full memory dump (a dump of the available portion of the system's physical memory).
All crash dumps can be divided into two main categories:
- Crash dumps with information about the exception that occurred... Usually created in automatic mode, when an unhandled exception occurs in the application / kernel and, accordingly, the system (built-in) debugger can be called. In this case, information about the exception is written to the dump, which makes it easier to determine the type of exception and where it occurred during subsequent analysis.
- Crash dumps without exception information... Usually created by the user manually when it is necessary to create a simple snapshot of the process for subsequent analysis. This analysis does not imply the determination of the type of exception, since no exception did not arise, but analysis of a completely different kind, for example, the study of process data structures and so on.
Kernel memory dump configuration
You must be logged in with an administrative account to complete the steps in this section.
Let's go directly to configuring Windows Crash Dump settings. First, we need to go to the system properties window in one of the following ways:
- Right-click on the icon "My Computer" - "Properties" - "Advanced system settings" - "Advanced".
- "Start" button - "Control Panel" - "System" - "Advanced system settings" - "Advanced".
- The shortcut keys "Windows" + "Pause" - "Advanced system settings" - "Advanced".
control system.cpl, 3- Run in command line (cmd):
SystemPropertiesAdvanced
The result of the described actions is to open the "System Properties" window and select the "Advanced" tab:
After that, in the "Startup and Recovery" section, we click select "Options" and thereby open a new window called "Startup and Recovery":

All crash dump parameters are grouped in a parameter block called System Failure. In this block, we can set the following parameters:
- Write events to the system log.
- Perform an automatic reboot.
- Writing debug information.
- Dump file.
- Overwrite existing dump file.
As you can see, many of the parameters from the list are quite trivial and easy to understand. However, I would like to elaborate on the "Dump File" parameter. The parameter is presented as a drop-down list and has four possible values:
Small memory dump
A small memory dump (minidump) is the file that contains the least amount of crash information. Smallest of all possible memory dumps. Despite the obvious drawbacks, it is often the minidumps that are used as information about a failure to be passed on to a third-party driver vendor for further study.
Composition:
- Error message.
- Error value.
- Error parameters.
- The processor context (PRCB) that crashed.
- Process information and kernel context (EPROCESS) for the crashing process with all its threads.
- Process information and kernel context (ETHREAD) for the crashing thread.
- The kernel mode stack for the thread that caused the crash.
- List of loaded drivers.
Accommodation: % SystemRoot% \\ Minidump \\ MMDDYY-XXXXX-NN.dmp... Where MMDDYY is the month, day and year, respectively, NN is the serial number of the dump.
Size: The size depends on the bitness of the operating system: only 128 kilobytes for a 32-bit and 256 kilobytes for a 64-bit OS are required in the paging file (or in the file specified in DedicatedDumpFile). Since we cannot set such a small size, we round up to 1 megabyte.
Kernel memory dump
This dump type contains a copy of all kernel memory at the time of the crash.
Composition:
- List of running processes.
- The state of the current thread.
- Kernel-mode memory pages present in physical memory at the time of failure: kernel-mode driver memory and kernel-mode program memory.
- Hardware-dependent level memory (HAL).
- List of loaded drivers.
There are no unallocated and user-mode pages in the kernel memory dump. Agree, it is unlikely that the user-mode process pages will be of interest to us during a system crash (BugCheck), since a system crash is usually initiated by kernel-mode code.
Size: Varies based on the size of the kernel address space allocated by the operating system and the number of kernel-mode drivers. Typically, it requires about a third of the physical memory in the paging file (or in the file specified in DedicatedDumpFile). It may vary.
Complete memory dump
A complete memory dump contains a copy of all physical memory (RAM, RAM) at the time of the crash. Accordingly, the entire contents of the system memory are included in the file. This is both an advantage and a major disadvantage, as its size can be significant on some servers with large amounts of RAM.
Composition:
- All pages of "visible" physical memory. This is practically all the system memory, with the exception of areas used by the hardware: BIOS, PCI space, etc.
- Data from the processes that were running on the system at the time of the crash.
- Physical memory pages that are not mapped to virtual address space, but which can help you investigate the cause of failure.
A full memory dump does not include, by default, areas of physical memory used by the BIOS.
Location:% SystemRoot% \\ MEMORY.DMP. The previous dump is overwritten.
Size: In the paging file (or in the file specified in DedicatedDumpFile), a volume equal to the size of physical memory + 257 megabytes is required (these 257 MB are divided into a certain header + driver data). In fact, in some operating systems, the lower threshold for the paging file can be set exactly to the size of the physical memory.
Automatic memory dump
Starting with Windows 8 / Windows Server 2012, a new dump type called "Automatic Memory Dump" was introduced into the system, which is set as the default. In this case, the system itself decides which memory dump to write in a situation of one or another failure. Moreover, the choice logic depends on many criteria, including the frequency of the operating system crashing.
After changing the Windows memory dump configuration, you may need to restart your computer.
Registry parameters
Registry key that defines crash dump parameters:
HKEY_LOCAL_MACHINE \\ SYSTEM \\ CurrentControlSet \\ Control \\ CrashControl
Options:
| Parameter | A type | Description |
|---|---|---|
| AutoReboot | REG_DWORD | Enable / disable automatic reboot when BSOD occurs. |
| CrashDumpEnabled | REG_DWORD | The type of dump to be generated.
|
| DumpFile | REG_EXPAND_SZ | The path and name of the kernel memory dump and full memory dump. |
| DumpFilters | REG_MULTI_SZ | A filter driver in the memory dump driver stack. Allows you to add new functionality at the stage of creating crash dumps. For example, encrypting the contents of the dump. It is not recommended to change the value. |
| LogEvent | REG_DWORD | Writing an event to the system log. |
| MinidumpDir | REG_EZPAND_SZ | The path and name of the small memory dump. |
| MinidumpsCount | REG_DWORD | The maximum number of small memory dumps. If exceeded, older versions are overwritten. |
| Overwrite | REG_DWORD | Overwrite existing dump file. For kernel memory dump and full memory dump only. |
| IgnorePagefileSize | REG_DWORD | Ignores the standard paging file as a temporary (intermediate) storage dump. Indicates that the memory dump should be written to a separate file. Used in conjunction with the DedicatedDumpFile option. |
| DedicatedDumpFile | REG_EZPAND_SZ | Path and name of the temporary alternate file for writing the memory dump. In the second pass, the data will still be moved to DumpFile / MinidumpDir. |
Manually creating a memory dump
Above, we described the settings for automatically creating crash dumps of the system in case of a critical error, that is, an unhandled exception in the kernel code. But in real life, in addition to the crash of the operating system, there are situations when it is necessary to get a dump of the system memory at a specific point in time. How to be in this case? There are methods to take a snapshot of all physical memory, such as using the dump command in the WinDbg / LiveKD debuggers. LiveKD is a program that allows you to run the Kd kernel debugger on a live system in local mode. The WinDbg debugger also has this capability. However, the on-the-fly dump method is not accurate because the dump is inconsistent because it takes time to generate the dump, and if you use the kernel-mode debugger, the system continues to run and make changes to memory pages.
I will continue to talk about the blue screen of death, started in.
So, if the computer suddenly restarts or freezes, and the blue screen of death does not appear or appears for a split second, you can still recover information about the causes of the failure.
The fact is that the operating system at the time of failure saves the contents of the RAM in the so-called dump file (has the extension .dmp). In the future, the dump file can be analyzed and obtained the same information as on the blue screen and even a little more.
But the creation of dumps can be disabled in the system, so it is worth making sure that, firstly, the system creates dumps in case of failures, and, secondly, it is worth finding out the place on the disk where they are saved.
To do this, go to the section System.
In Windows 10, this can be done through the search, and in previous versions of the operating system through the Control Panel.
Here, the recording of events in the system log should be enabled, well, so that the computer does not automatically restart and display the contents of the blue screen of death to us, you need to cancel the automatic restart, if it was enabled.
The path to the dumps is also displayed here - we see that the dump is saved to the% SystemRoot% folder - this is the designation of the Windows folder.
Here you can also select "small memory dump", which will be quite enough to search for error codes.
So, the system crashed into a blue screen of death, after which a memory dump was created.
There are special programs for analyzing dumps, and one of the most popular is the BlueScreenView utility.
The program is very easy to use and does not require installation - download from the official site and unzip it. At the same time, you can download a file from the official site with which you can Russify the program. To do this, this file will need to be placed in the folder with the unzipped program.
If after starting the program does not display dumps, although the system "breaks down" into the blue screen of death, then you should go to the program settings and make sure that the path to the memory dumps is correct, that is, it should be the same as in the system settings.

After that, you need to update the information in the program window and all dumps created in the system will be displayed. If there are several dumps, then we are guided by the failure date. We select the required dump, and then detailed information on it will appear.
Here you can see the name of the error, its STOP code with parameters, and if the cause is a driver, then in the corresponding field we will find its name.
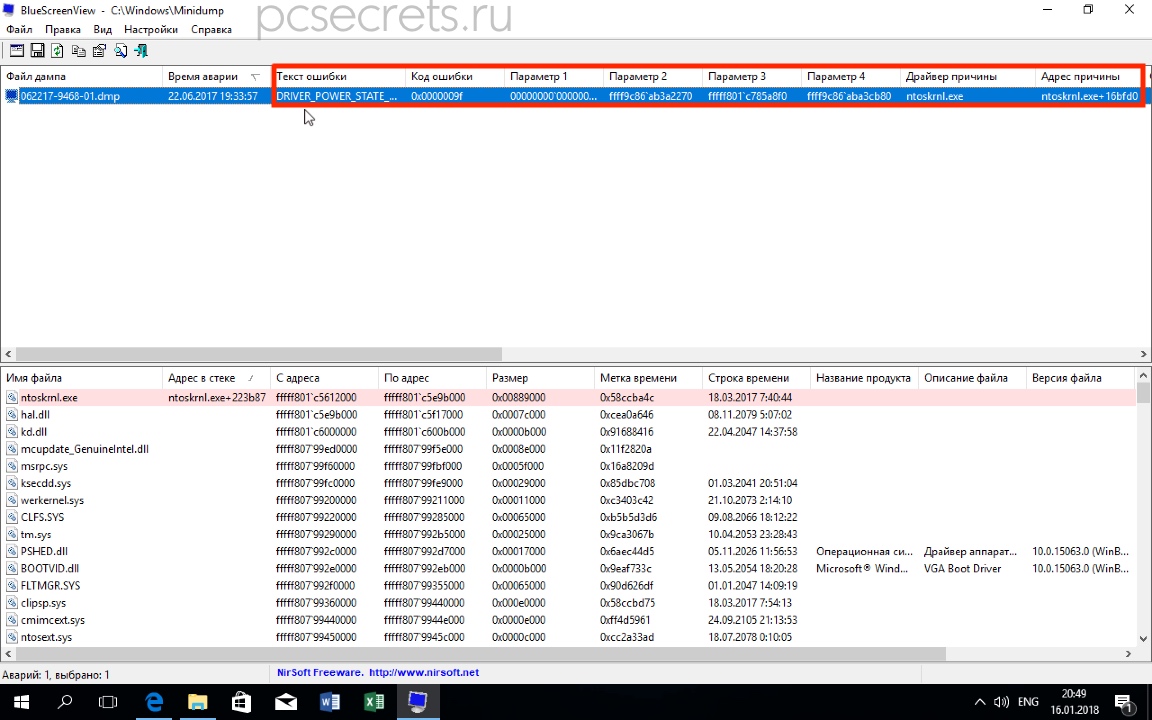
Also, in the lower part of the program window, files that could also cause the crash will be highlighted in pink. We'll have to deal with each of them in order. The algorithm here is similar to that discussed in the previous post - we are looking for a solution on the Internet, and as a search key we use the file name or error code.
In this case, it is not necessary to manually enter data into the search engine. If you right-click on the dump line, then from the context menu you can select an item that will allow you to find a description of this particular problem in Google.
You can choose to search Google by error code, by error code and driver name, or by error code and parameter.
Also, using this utility, you can quickly find the location of the problem file on the disk.

Sometimes it happens that the file that caused the problem belongs to a program or game. By the location of the file on the disk, you can quickly determine which program or game it belongs to.
Well, you should know that cleaners seem to delete memory dumps, so if you use such programs, then at the time of identifying the cause of the blue screen of death, you should refrain from using them.
And the last question I will answer in this post is what to do if the computer does not start after the blue screen appears? That is, the computer freezes or constantly reboots, which means there is no way to analyze the memory dump.
The answer is logical and simple - you need to create a bootable USB flash drive with which to "pull" the dump file from the hard disk and analyze it on another computer. To do this, boot from the USB flash drive and on the hard drive of the computer in the folder Windows or in a subfolder minidump we find the dump file, which we copy to the USB flash drive. Then on another computer using the utility BlueScreenView analyze the dump, as described in this article.
When a critical error occurs while working with Windows, the user may ask the question: how can you access the Windows crash dump? Such a dump, if properly configured, will help start the system in the event of a crash or the so-called blue screen of death (BSOD).
If you encounter problems during the memory dump setup process or the operating system does not work correctly after that, you can.
Windows 10 memory dump
A memory dump is what resides in the working memory of the entire operating system, the processor and its cores. Including all information about the state of processor registers and other service structures.
What is a Windows 10 memory dump for?
Windows 10 memory dump is a kind of black box. In the event of an accident in the system, the information stored in it will help to study in detail the causes of the system failure. This failure, as a rule, completely stops the operation of the operating system. Therefore, a memory dump is the only and surest way to get information about any failure in the system. And its receipt is an actual snapshot of the information in the system.
The more accurately the contents of the memory dump will reflect what was happening in the system at the time of the failure, the easier it will be in analyzing the emergency situation and further actions to correct it.
It is imperative that you get an up-to-date copy exactly at the moment that was immediately before the failure. And the only way to do it is to create a crash dump of Windows 10 memory.
The causes of errors in Windows 10 are very diverse:
- incompatibility of connected devices;
- new Windows 10 updates;
- incompatibility of installed drivers;
- incompatibility of installed applications;
- and other reasons.
How to set up a memory dump in Windows 10?
In order to configure a Windows 10 crash dump, you must follow these steps:
1. Right-click on the start of Windows 10. In the context menu that appears, select the "System" item.
2. In the “System” window in the upper left corner, select “Additional system parameters”.

3. In the window "System Properties" in the item "Startup and Recovery" click "Options".

This is where the Windows 10 crash dump is configured.

When configuring a memory dump, you can not neglect the following recommendations:
- Check the box "replace existing dump file". Given the fact that data can weigh tens or even hundreds of gigabytes, this is very useful for small hard drives;
- Writing debug information. This function will allow you to select the type of dump file;
- Perform an automatic reboot. Continuing work after an error occurred;
- Writing an event to the system log. System crash information will be added to the operating system logs.
Windows 10 memory dump is a convenient and really working method of insuring system data.
Knowing the "enemy in the face" it will be much easier to find and eliminate. A Windows 10 memory dump will allow you to identify the cause of the system failure and adjust the actions to eliminate the error, significantly reducing the radius of effort and work.
In Windows 8, Microsoft introduced a new memory dump - an automatic memory dump option. This parameter is set by default in the operating system. Windows 10 introduced a new type of dump file - active memory dump. For those who don't know, in Windows 7 we have a small dump, a kernel dump and a full memory dump. You may be wondering why Microsoft decided to create this new memory dump setting? According to Robert Simpkins, senior support engineer, an automatic memory dump can create support for a “system” page in a configuration file.
The paging file configuration management system is responsible for managing the size of the paging file - this avoids unnecessary swap space or size. This option was introduced mainly for PCs that run on SSDs, which tend to have a smaller size but a huge amount of RAM.
Memory dump options
The main advantage of Auto Memory Dump is that it allows the subsystem session in Process Manager to automatically shrink the paging file to less than the size of RAM. For those who don't know, the subsystem manager session is responsible for initializing the system, the startup environment for the services and processes that are required for a user to log on to the system. It basically sets the file page to virtual memory and starts the winlogon.exe process.
If you would like to change your automatic memory dump settings, here's how to do it. Press Windows key + X and select - System. Then click on the button "Advanced system settings - Advance System Settings”.
Click the Advanced system settings button.

Here you can see a drop down menu where it says "More".

Here you can select the option you want. Suggested options:
No memory dumps.
Small memory dump.
Kernel memory dump.
Complete memory dump.
Automatic memory dump. Added in Windows 8.
Active memory dump. Added to Windows 10.
The location of the memory dump file is in% SystemRoot% \\ MEMORY.DMP.
If you are using an SSD drive, it is best to leave it on “Automatic Memory Dump”; but if you need a crash dump file it is better to set it to a “small memory dump”, with it you can send it to someone if you want to have a look at it.
In some cases, you may need to increase the size of the paging file larger than your RAM so that it can fit a complete memory dump. In such cases, you need to create a registry key:
HKEY_LOCAL_MACHINE \\ SYSTEM \\ CurrentControlSet \\ Control \\ CrashControl
it's called “LastCrashTime”.
This will automatically increase the size of the paging file. To reduce it later, you can simply delete this key.
Windows 10 introduced a new active memory dump dump file. It contains only the essentials and is therefore smaller.
I have no way to test it, but I generated this key and monitored the paging file size. I know that sooner or later I will get a critical error. Then I'll check it out.

You can analyze memory dump of Windows.dmp files using WhoCrashed. The WhoCrashed Home utility is free and features drivers that have been embedded into your computer with a single click. In most cases, it can identify a broken driver that is causing suffering to your computer. This is a crash dump of system analysis, memory dumps and all the collected information is presented here in an accessible form.

Typically, the debug toolbox opens the crash dump of the analysis. With this utility, you don't need any knowledge and debugging skills to figure out which drivers are causing problems on your computer.
WhoCrashed relies on Microsoft's debug package (windbg programs). If this package is not installed, WhoCrashed will download and automatically extract this package for you. Just start the program and click on the Analysis button. When you have WhoCrashed installed on the system and if it resets or closes unexpectedly, the program will let you know if crash dump is enabled on your computer and it will offer you suggestions on how to enable them.
Critical Windows blue screen errors (BSODs) are often caused by a newly installed or corrupted driver. Having determined which driver is causing the error, you can start troubleshooting the problem: update the driver, roll back to an earlier version, reinstall or remove the application that installed the driver, etc. The driver name is not always displayed on a blue screen. However, there is a very simple way to use a memory dump to identify the problem driver in a couple of minutes.
Step 1 - Enabling Memory Dump Writing
First you need to make sure that dump recording is enabled. To do this, open the system properties by pressing the key combination Win + Pause, [in Vista click the link Additional system parameters], go to the tab Additionally, and finally press the button.
Small the memory dumps should be sufficient for our purposes.
Pay attention to the path to the folder where they will be saved when a critical error occurs.

Now you can zip the file, attach it to the forum post Troubleshoot critical Windows errors and wait for someone to tell you the name of the problematic driver :) But you can do it yourself without much effort.
Step 2 - Analyzing the dumps using the MinDumper utility
You will find a story about the utility in this article.
- Download and install Debugging Tools for Windows. They are included with the Windows Web Installer SDK, where once launched, you need to select Debugging Tools under Common Utilities.
- Download scenario (kdfe.cmd), which was written by Alexander Sukhovey and published on the resource sysadmins.ru (since I could not find a live link there, I offer my own). Unpack the archive to any folder.
Note... If the Program Files folder is located in a non-standard location, you may need to specify the path to the folder where Debugging Tools for Windows is installed in kdfe.cmd. Use the dbgpath variable on line 41.
Step 3 - Analyzing the Memory Dump
Now it all comes down to running one command. Open command prompt and navigate to the folder where you unzipped kdfe.cmd... Run the file, specifying the path to the memory dump file as a parameter (in the example below, the file is named Mini1110307-01.dmp)