Very often, users forget about the heating of computer components, which overheat during its operation, the computer starts to malfunction and eventually breaks down. This is most often due to accumulated dust in the system unit, dusting of coolers, an outdated cooling system, etc.
Good evening, dear friends, acquaintances and other persons. From the title of the article, you probably already guessed that it would be about heating the components of the computer, what it should be and how to measure it. Each electronic device has the property of heating up during its operation, but there are still certain standards within which this component can operate normally and for a long time.
Well, and another sign of the computer overheating, this is of course our hot summer. The increase in air temperature jumped noticeably, noticeably not only for people, but also for our computers, which are already in constant heat ( at work, respectively), and then the sun outside the window unbearably fries. As a result of overheating of components ( processor, power supply, video card ...) the computer begins to malfunction in the form of periodic reboots, shutdowns, or may even burn out.
The program for measuring the temperature of the components of the computer HWMonitor:
This utility is simple and convenient to use, does not require installation and other various body movements. You can download the utility at this link. Unzip the archive to any convenient place on your computer, then run the file with the extension .exe according to your system capacity.
The program is in English, which for some users will give inconvenience to use, but I think its value is not necessary, everything is extremely simple and clear. HWMonitor will measure various components of the computer, measure the voltage ( graphics cards, power supply, processor, hard drives ...) will determine the speed of rotation of the fans, in general, all that is needed ...
The program for measuring the temperature of computer components during the operation of AIDA64:
You can download the program from the Internet, or here this link. This program is in Russian and does not require installation, you only need to unzip the archive and run the file aida.exe.

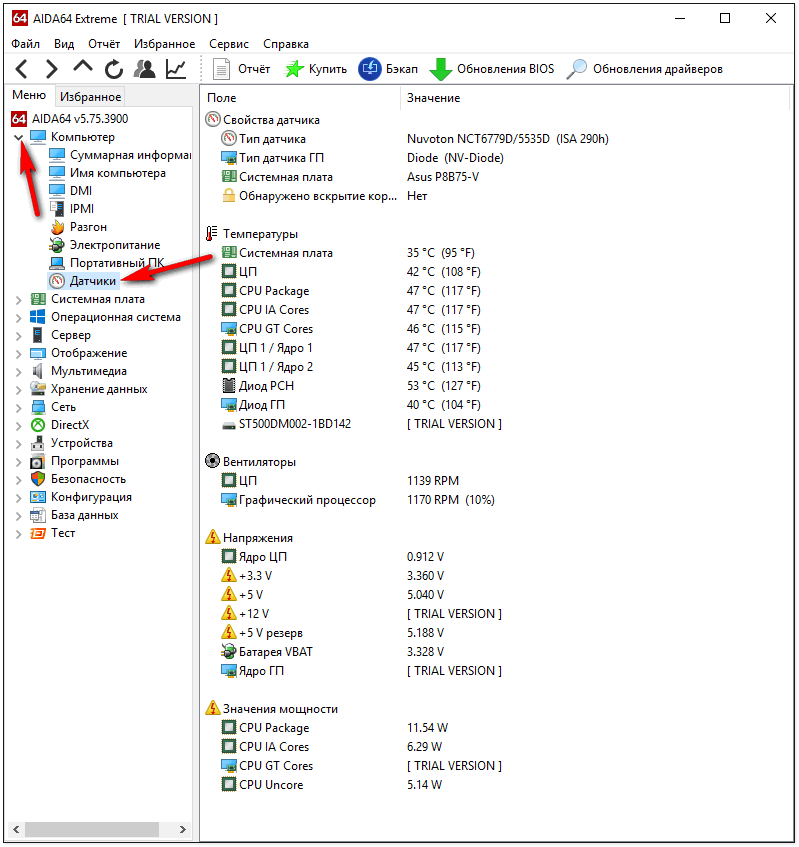
In the main window of the program, go to the "Computer", "Sensors" section. Here is all the temperature information for all components of your computer.
What temperatures can we observe using the AIDA64 program:
- CPU temperature ( central processor), as well as processor cores;
- Video Cards ( graphics processor);
- Video Card Memory Temperature ( graphics processor);
- Motherboard ( main board in computer), to be more precise, the temperature of its chipset;
These are the main components that need to be monitored in order to avoid their overheating, especially in very hot summer days.
What temperatures are critical:
On the Internet, there are very often questions: why the computer restarts by itself, in connection with which the device freezes and urgently shuts down, what should I do if the monitor does not work stably.
The first thing you think about is the presence of viruses, but in most cases the problem is overheating of the processor or video card. In this article, we will consider practical and easy-to-use software tools for displaying temperature indicators.
Why do I need to know the temperature of the hardware
The temperature of the processor or video card in working condition is constantly changing. A computer or laptop may suddenly shut down from overheating, resulting in data loss. Therefore, if you want to avoid critical temperatures and prevent equipment damage, you must use special software. With their help, you can observe the temperature indicators of the heating of the processor, video card, hard drive at the time of their operation.
Core tools
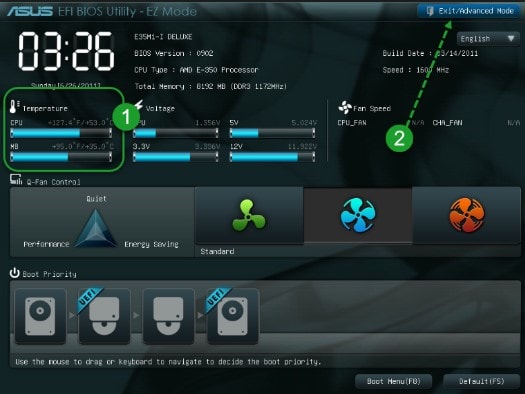
You can check the temperature by going to the BIOS. To do this, you must restart the operating system, while turning on the computer, press the "F2" or "Delete" key, depending on the version of the device. After entering the BIOS, you need to find the “H / W Monitor” section and select it. After that, the temperature indicators of the hardware components will be displayed.

The main disadvantage is that there is no way to see the temperature at the time of the computer and its load. Therefore, further we will consider the most useful software products.
Hwmonitor
"HWMonitor" is a program for monitoring the temperature indicators of the processor and video card. It also allows you to find out the fan speed and voltage data. This program can be downloaded from the official website.
- After launching the application, all the main devices will be displayed: processor, hard drive, integrated and discrete video cards, laptop battery.

- Having opened all points of the processor, the current maximum and minimum temperature values \u200b\u200bcollected during the operation of the PC will be displayed. The processor includes the following items: voltage, temperature, degree of congestion, as well as its frequency.

- About the hard drive, only its temperature is indicated.

- Next are the integrated and discrete graphics cards. The program shows the temperature and frequency for the integrated, in a discrete instead of the frequency, the load is displayed.

- The battery item is indicated only for a laptop, it displays the consumed voltage, power and battery wear levels.

AIDA 64 Extreme Edition

"AIDA 64 Extreme Edition" is an extensive complex of diagnostics and testing of computer hardware components. The program has many features:
- real-time monitoring of computer hardware and system components;
- testing of computer hardware;
- diagnostics of components for problems and errors;
- system and application analysis;
- monitoring of temperature, voltage and fans.
It should be said that the program is paid. Its trial version is limited to 30 days of use - this is the main drawback.
This utility can be downloaded from the official site, consider where to find the temperature indicators of the computer:
- After installing the program, run it by double-clicking on the shortcut.
- In the window that opens, double-click on the item "Computer" and in the list that opens, select the item "Sensors".
- Detailed information will open about all the components of the computer equipped with a temperature sensor, including the main ones: “CPU” (Central Processing Unit) and “GPU” (Video Card).

MSI AfterBurner
MSI AfterBurner is a multifunctional utility that is aimed at monitoring the performance of a video card. Often it is used by gamers to overclock the graphics card and to monitor its performance like this:
- increase in memory clock frequency;
- cooler rotation adjustment;
- fPS monitoring (a number indicating how many times per second the GPU updates the image);
- notification of an increase in critical temperature values.
You can download this program from the developers site using this link. Consider the main parameters of the program:

What to do if the temperature is elevated?
A normal temperature during processor operation is considered to be up to 60 degrees, graphics cards - up to 80 degrees.
If you find the problem of overheating devices, then consider the primary solutions:
- First of all, turn off the computer or shut down the program, which leads to overheating.
- It is necessary to ensure good blowing of coolers, to completely clean the computer from dust.
- Decrease in ambient temperature. Often, high room temperatures affect the temperature of the computer's hardware. To exit this situation, you can use the air conditioner or fan.
- Installing a more powerful cooling system. Installing additional coolers for the processor and video card will solve the problem. You can also use stands for a device with a cooling system.
But the safest and most correct advice is to take the computer to a service for a complete diagnosis and further repair or cleaning. This concludes the review of tools, if you know more convenient and high-quality software solutions, write in the comments.
You need to constantly monitor the temperature of the processor or video card, because if they overheat, your PC will not start corny. On this page you can download a convenient program for checking the temperature of various components of your PC on Windows 10.
In order to be able to regularly monitor the status of the hardware of your own PC, it is worth using special utilities. But what program is better to check the temperature of the processor and video card today than others? It is rather difficult to answer this question unequivocally. But still there is the possibility of comparing similar utilities for some indicators. It is precisely such a comparison that will be discussed later.
What should be the program for checking the temperature of the video card and processor
If you are trying to choose a utility for monitoring the status of your own PC, then you are surely looking for software that will provide you with the most necessary data. And what are these indicators? One of the most important should be the following:
- CPU temperature indicators;
- Hard drive;
- Display the temperature of the video card;
- Graphs of the dynamics of such indicators;
- The ability to change the rotation of coolers.

This is only part of the features. As additional, it would be nice to have the following:
- The ability to notify the user of exceeding critical indicators;
- The output of relevant information in the form of a separate gadget or something similar;
- The ability to test the stability of the system depending on the load on it.

You can say that these are pretty high requirements for utilities of this kind. However, at present, almost all of this has already been implemented. Therefore, let's see which programs for checking such data are best used:
- MSI Afterburner
- SpeedFan and some others.
MSI Afterburner can be used not only to monitor the temperature of computer hardware, but also to overclock the CPU. This utility removes all indicators from the sensors of the motherboard and passes them to the user. But this application is not too well suited for the task considered here, although it has a rather high functionality. The fact is that you will need to spend a lot of time studying the interface of this software. While other utilities are much simpler in this regard.
Some users complain that the fan in the system unit is too noisy. The SpeedFan utility will help you reduce the noise, the manipulations with which will help to cope with overheating and at the same time reduce the sound of the PC.
On this page you can download the AIDA64 distribution, as we consider this product the best on the market among all the tools for measuring the performance of internal components.
Temperature - is one of the most important conditions for stable and long-term computer operation.
Today, there are a huge number of programs for measuring the temperature of a computer, they allow you to receive in real time information about the temperature status of almost all nodes of the system unit.
Symptoms of overheating.
When the processor overheats, the computer starts to turn off spontaneously, suddenly reboots, starts to slow down, freeze, slow down, during any action this symptom is especially noticeable in games. If, after turning on the power of the computer, a message such as: Warning: Your computer CPU Fan Fail or speed too lowYou can also disable this warning message in SETUP, then this is a problem with the cooler, maybe it got dusty or something got into it.
CPU.
And so we check the temperature of the processor using the programs described below. The processor temperature in unloaded mode should be approximately 40 - 45 degrees. Under heavy loads of modern games, the temperature should not exceed 70 degrees. However, for some processors the temperature value may differ. I advise you to find out the operating temperature of your processor in the search.
If the processor temperature is above normal, then the cooler may have clogged with dust or the thermal grease has dried on the radiator. The cooler may also be malfunctioning or a more efficient cooling system needs to be installed; you can also install an additional cooler to remove heat from the system unit case.
 Video card
When idle, the temperature of the video card should be approximately 40 degrees with a load of up to 80 degrees; some gaming video cards can warm up to 90 degrees.
If the video card overheats, then the methods for eliminating overheating are absolutely the same as in the case with the processor. Replace thermal grease and clean from dust.
 HDD
HDD
On a computer, the hard drive should not exceed 40 degrees; if it is a laptop, it should not exceed 50 degrees.
Programs for measuring the temperature of the processor.
 1.Speccy - will give you detailed statistics for each piece of hardware in your computer. Including central processor, motherboard, RAM, graphics cards, hard drives, optical drives, audio support. Additionally, the program adds the temperature of your various components.
 2.SpeedFan- A small application with which you can control the speed of rotation and temperature of the fans in the system unit of the computer.
 3.HWMonitor - The program is designed to monitor the performance of various components of the computer. This includes temperature, fan speed, and voltage.
 - A popular program for the review and diagnosis of all computer nodes. AIDA64 will give you detailed information about the composition of the computer: hardware, programs, temperature, operating system, network and connected devices.
 5.EVEREST Ultimate Edition -An application designed to test and diagnose hardware on a computer.
Summer! August! Hell! Users are many times more likely to fry the "heart" of their computer, so it is very important to monitor in real time how the temperature of the processor changes in order to prevent a disaster called "overheating" in time.
Small and free program Core temp displays the temperature of all processor cores in the taskbar (in the notification area), shows how loaded it is and at what frequency does it work at a given timehow much RAM is used.
I hope that for many users, the information listed above will make you think about startup optimization, pay attention to the number of programs running in the background (and generally unnecessary unnecessary programs) ... in short - to minimize the load on the processor and thereby get rid of "glitches" and brakes, speed up the computer.
If the "software" actions are not enough, then you have to climb up with your feet into the system unit (or into the laptop case) and clean it of dust accumulated there. By the way, have you changed thermal grease under cooling radiators for a long time? After all, it tends to dry out over the years.
CPU temperature in the notification area
So, displaying the temperature of the processor and some other numbers in the notification area is not at all difficult - just run the Core Temp program.
Install Core Temp
There is a small but nasty nuance in installing Core Temp, so do not rush to poke all the way to the "Next" ...
They offer to build some kind of kingdom - do you need it? Uncheck this box necessary to avoid the installation of "padding".
After a successful installation, run the program ...

As you can see - a lot of information about our processor. Now it remains to configure the program for yourself ...
Configure Core Temp
We poke on “Parameters” and turn on the protection against overheating - this function can save your computer from repair ...

You can also look at the "Settings" and ...

... install the Core Temp program in startup, simultaneously correcting other parameters and values. For example, you can specify in which form to run the program or how to minimize it ...

Here you can easily change the color of the numbers. If you changed the transparency of the taskbar or its color, the readings may merge and become subtle.

The temperature of the processor is not the only value that can be displayed on the taskbar - set the daws you need and get additional data displayed in real time.
For owners of Logitech G1x / G5xx series mice, the program provides a bonus ...


To "Update Intel drivers" there is a much better tool that i already described to you.
Now you have the temperature of the processor and other useful data will always be in front of your eyes ...

Download Core Temp
You can download the program from its official website by clicking on the link button below ...

The installer size is only 1.1 Mb. There are no viruses. The program works in almost all versions of the operating system - Microsoft Windows XP, Vista, 7, 8, 10, 2003 Server, 2008 Server (R2), 2012 Server and "understands" Intel, AMD or VIA x86 based processor processors.