tcpdump is a powerful command line analyzer and Libpcap, a portable library for capturing network traffic. Tcpdump prints a description of the contents of packets on the network interface that match a boolean expression. It can also be run with the -w switch, which invokes it to save the batch data to a file for later analysis, and / or with the -r flag, which causes it to read from the saved batch file. With the help of this utility, you can intercept and also analyze network traffic that passes through the PC on which this program is running.
I would like to talk in this topic "installing and using tcpdump" about installing tcpdump, as well as how to use it and what it is for.
With tcpdump you can:
- You can debug network applications.
- You can debug the network or network equipment in general.
To install tcpdump on debian / ubuntu / linux mint you need to run:
# sudo apt-get install tcpdump
To install tcpdump on RedHat / CentOS / Fedora use:
# sudo yum install tcpdump
To install tcpdump on MacOS use.
# brew install tcpdump
Using tcpdump.
To check if tcpdump works for us, you can run the command:
# tcpdump -i eth0 port 80
There are quite a few switches for using the tcpdump utility itself, I will give a list of common ones:

If you need to find out what packages 21 servers are exchanging (for example, your_server_1 and your_server_2), then the command is used for this:
# tcpdump host your_server_1 and your_server_2
If you need to monitor only outgoing packets from the host, then run:
# tcpdump src host your_server
If you need to monitor only incoming packets from the host, then run:
# tcpdump dst host your_server
You can also listen for outgoing or incoming packets from the server and on a specific port for this, just add the port you want to listen to (mostly 80, 8080 are used).
See the list of interfaces on which tcpdumt can listen:
# tcpdump -D
Listen interface eth0:
# tcpdump -i eth0
Play on any available interface (Requires Linux kernel 2.2 or higher):
# tcpdump -i any
Displaying everything on the screen (everything that is done by the program):
# tcpdump -v
Displaying a lot of things on the screen (everything that is done by the program):
# tcpdump -vv
There is a lot of output on the screen (everything that is done by the program):
# tcpdump -vvv
Print not much information when capturing packets (not as standard):
# tcpdump -q
Limit packet capture to 100:
# tcpdump -c 100
Write all data (captured packets) to a file named capture.cap:
# tcpdump -w capture.cap
Write all data (captured packets) to a file named capture.cap and display it in real time:
# tcpdump -v -w capture.cap
Outputting packets from capture.cap file:
# tcpdump -r capture.cap
Outputting packets from the capture.cap file using as much information as possible:
# tcpdump -vvv -r capture.cap
Outputting IP and ports instead of domains, packet capture is in progress:
# tcpdump -n
Capture any packets where the destination host is 192.138.1.1. IP output and ports on the screen:
# tcpdump -n dst host 192.138.1.1
# tcpdump -n src host 192.138.1.1
Capture any packets from host 192.138.1.1. IP output and ports on the screen:
# tcpdump -n host 192.138.1.1
Capture packets where the network is 192.138.1.0/24. IP output and ports on the screen:
# tcpdump -n dst net 192.138.1.0/24
# tcpdump -n src net 192.138.1.0/24
Capture packets from the 192.138.1.0/24 network. IP output and ports on the screen:
# tcpdump -n net 192.138.1.0/24
Capture packets from port 23. Display of IP and ports on the screen:
# tcpdump -n dst port 23
Capture packets from ports 1 to 1023. Display of IP and ports on the screen:
# tcpdump -n dst portrange 1-1023
Capture only TCP packets where destination is on ports 1 to 1023. Display of IP and ports on the screen:
# tcpdump -n tcp dst portrange 1-1023
Capture only UDP packets where destination is on ports 1 to 1023. Display of IP and ports on the screen:
# tcpdump -n udp dst portrange 1-1023
Capture packets from destination where IP is 192.138.1.1 and destination port is 23. Display:
# tcpdump -n "dst host 192.138.1.1 and dst port 23"
Capture packets from destination where IP 192.138.1.1 and destination on ports 80 or 443. Display:
# tcpdump -n "dst host 192.138.1.1 and (dst port 80 or dst port 443)"
Capture any ICMP packets:
# tcpdump -v icmp
Capture any ARP packets:
# tcpdump -v arp
Capture any ICMP or ARP packets:
# tcpdump -v "icmp or arp"
Capture any packets that are broadcast or multicast:
# tcpdump -n "broadcast or multicast"
Capturing large packets (500 bytes) and not standard 68b:
# tcpdump -s 500
Capture all bytes of data in a packet:
# tcpdump -s 0
Viewing "heavy packages":
# tcpdump -nnvvXSs 1514
Capturing ICMP packets with ping and pong:
# tcpdump -nnvXSs 0 -c2 icmp
Conclusion without many options:
# tcpdump -nS
Basic communications (very verbose mode), you can see a good amount of traffic, with verbosity:
# tcpdump -nnvvS
A deeper look at traffic, adding -X for the payload:
# tcpdump -nnvvXS
Browse the heavy package and increase the snaplength by grabbing the entire package:
# tcpdump -nnvvXSs 1514
You can also filter based on specific parts of the package, as well as combine multiple conditions into groups. This is useful when looking for SYNs or PCT only, for example, and the latter for even more advanced traffic isolation.
Show me all URGENT (URG) packages:
# tcpdump "tcp & 32! = 0"
Show me all the ACKNOWLEDGE (ACK) packets:
# tcpdump "tcp & 16! = 0"
Show me all PUSH (PSH) packages:
# tcpdump "tcp & 8! = 0"
Show me all RESET (RST) packages:
# tcpdump "tcp & 4! = 0"
Show me all SYNCHRONIZE (SYN) packets:
# tcpdump "tcp & 2! = 0"
Show me all FINISH (FIN) packets:
# tcpdump "tcp & 1! = 0"
Show me all SYNCHRONIZE / ACKNOWLEDGE (SYNACK) packets:
# tcpdump "tcp = 18"
Capturing TCP Flags using tcpflags:
# tcpdump "tcp & & tcp-syn! = 0"
Packets with RST and SYN flags (check):
# tcpdump "tcp = 6"
‘Evil Bit’ traffic (check):
# tcpdump "ip & 128! = 0"
This concludes my article "installing and using tcpdump", I hope everything is clear and understandable.
The tcpdump utility is a very powerful and popular tool for capturing and analyzing network packets. It allows you to view all incoming and outgoing packets from a specific interface and works from the command line. Of course, you could use Wirshark to analyze network packets, it's a graphical utility, but sometimes there are situations when you only need to work in the terminal.
Tcpdump is no worse than Wireshark, and has all the necessary capabilities for packet analysis, moreover, you can save all captured packets to a file to analyze them later using the same Wireshark. In this article, we will look at how to use tcpdump to capture network packets.
Many distributions come with the tcpdump command by default, but if your distribution doesn't have it, you can very easily install it from the official repositories. For example, on Ubuntu / Debian:
sudo apt install tcpdum p
On Fedora / Red Hat / CentOS:
sudo yum install tcpdump
When the installation is complete, you can go to work.
Tcpdump command
Before moving on to examples of working with the utility, let's look at its syntax and basic options. The command has the following syntax:
$ tcpdump options -i interface filters
When calling, it is imperative to pass the interface that you will monitor. If the interface is not specified, the first one in the list will be used. Options customize the display and basic functionality of the utility, and filters allow you to filter out unwanted packages. Now let's look at the main options:
- -A- output all packets in ASCII format;
- -c- close the program after intercepting the n-th number of packets;
- -C- when writing packages to a file, check the file size, and if it is larger than the specified one, create a new file;
- -D- display a list of available network interfaces;
- -e- display connection level information for each packet, this can be useful, for example, to display the MAC address;
- -f- display the domain name for ip addresses;
- -F- read packages from a file, not an interface;
- -G- create a new log file after a specified period of time;
- -H- detect 802.11s headers;
- -i- name of the interface for capturing packets. You can capture packets from all interfaces by specifying any;
- -I- switch the interface to monitor mode to capture all passing packets;
- -j- set the Timestamp format for recording packets;
- -J- see the available Timestamp;
- -K- do not check the checksums of packets;
- -l- add scrolling support to the output;
- -L- display the supported connection protocols for the interface;
- -n- do not display domain names;
- -r- read packages from a file created with -w;
- -v, -vv, -vvv- more detailed output;
- -q- display a minimum of information;
- -w- write the output to a file;
- -Z- the user on whose behalf the files will be created.
These are not all options, but they will be enough for you for most tasks. More often we will apply filters. Using filters, you can filter out only those packet types that you want to see. You can filter by ip address, protocol, network, interface and many other parameters. But we will consider tcpdump filters by examples.
How to use tcpdump
Before moving on to using tcpdump, you need to look at what network interfaces you can use. To do this, run the command with the -D option:
Let's start looking at examples of tcpdump by capturing traffic on the eth0 interface, for me this is the main interface that is connected to the Internet. The program needs superuser rights to work, so do not forget to specify sudo:
sudo tcpdump -i eth0

To stop the command, press Ctrl + C. In the output, you will immediately see all captured packets. The recording format for each packet will look like this:
13: 03: 41.795599 IP udp032919uds.hawaiiantel.net.6881> 192.168.1.2.52055: Flags [.], Seq 640160396: 640161844, ack 436677393, win 2050, options, length 1448
This format is typical for data packets, depending on the protocol, the text highlighted in black will differ. First comes the timestamp, then the protocol, then the sender's ip address is marked in green, and the recipient's address in blue, in this case, our computer. Then there are additional tcp parameters and at the end the packet size in bytes. The verbosity of the output can be controlled with the -v options, For example:
sudo tcpdump -v -i eth0

There is already information about the IP protocol here:
IP (tos 0x0, ttl 64, id 50309, offset 0, flags, proto TCP (6), length 64)
We can find out information about the TTL packet lifetime, the TCP version and the length of the header field. The -vv option will print package checksum checking and contents in some cases.
After the options, you can specify filters for packages. Here are the main parameters by which you can filter packets:
- host- hostname;
- ip- ip address;
- proto- protocol;
- net- network or subnet address;
- port- port address;
- src- parameter concerning the sender;
- dst- parameter concerning the recipient;
- The following protocols are available: ether, fddi, tr, wlan, ip, ip6, arp, rarp, decnet, tcp and udp.
You can combine all this with each other to get the desired result. Let's take a closer look at examples. Let's filter out only packets addressed to our computer:
sudo tcpdump -i eth0 ip dst 192.168.1.2
We can also select packets sent to a specific node:
sudo tcpdump -i eth0 dst host google-public-dns-a.google.com
As you can see, these are DNS packets, and instead of TCP flags, useful information is contained, a request for the ip address of the host. You can also select response packets from a specific host:
sudo tcpdump -i eth0 src host google-public-dns-a.google.com

The full contents of the package are not here, if you want to get it you need to use the -v or -vv option:
sudo tcpdump -vv -i eth0 host dst google-public-dns-a.google.com
 With the and operator, you can combine multiple filters into one:
sudo tcpdump -i eth0 dst host google-public-dns-a.google.com and src host google-public-dns-a.google.com

Both and and or are available from the join operations, and parentheses can also be used to denote precedence. You do not need to specify host, in many cases src or dst is enough, the utility itself will understand what was meant. The exact same design can be used for ports. For example, we can filter out all requests or responses to DNS (on port 53):
sudo tcpdump -vv -i eth0 port 53

Exactly the same can be done for http (port 80):
sudo tcpdump -vv -i eth0 port 80
Naturally, you can also use dst and src here for more specific results. You can filter not one port, but a whole range of ports:
sudo tcpdump portrange 21-23
If you specify one of the protocols, you will filter out only packets of that protocol, for example tcp, udp, or arp:
sudo tcpdump -vv arp

Likewise, you can select all udp packages:
sudo tcpdump -vv udp
A filter by network designation is also available:
sudo tcpdump net 129.168.1.1/24
Alternatively, you can filter packets based on their size, for example, less than 32 bytes:
sudo tcpdump less 32
Or more than 128:
tcpdump greater 128
sudo tcpdump -i eth0 -w file.pcap
This file can be opened with any program for reading such files, for example, Wireshark. To open packages saved to a file, use the -r option:
sudo tcpdump -r file.pcap
There is one more thing worth paying attention to. This is the format for displaying the contents of packages. You can display the contents of a package in ASCII format using the -A option:
sudo tcpdump -A -i eth0

Also you can display content in HEX and ASCII format use -XX for this:
sudo tcpdump -XX -i eth0

conclusions
In this article, we have covered how to use tcpdump. It is a very powerful network analyzer that only works through the command line. I hope this information was useful to you and now using tcpdump will be much easier, if you still have questions, ask in the comments!
To complete the tcpdump lecture video:
The tcpdump command is also called a packet sniffer.
The tcpdump command will work on most flavors of the UNIX operating system. tcpdump allows us to save captured packets so that we can use the captured packet for further analysis. The saved file can be viewed with the same tcpdump command. We can also use open source software like Wireshark to read tcpdump PCAP files.
In this tutorial, we'll go over some practical examples of how to use the tcpdump command.
1. Capturing packets from a specific LAN interface using tcpdump -i
When running tcpdump without any option, it will capture all packets passing through all interfaces. Option -i tcpdump command, allows filtering on a specific Ethernet interface.
$ tcpdump -i eth1 12: 59: 41.967250 ARP, Request who-has free.msk.ispsystem.net tell gw.msk.ispsystem.net, length 46 12: 59: 41.967257 ARP, Request who-has reserve.scoffserver.ru tell gw.msk.ispsystem.net, length 46 12: 59: 41..44141> wdc-ns1.ispsystem.net.domain: 14799+ PTR? 184.48.146.82.in-addr.arpa. (44) ...
In this example, tcpdump captures all packets of the stream on interface eth1 and displays them on standard output.
Note:
The Editcap utility is used to select or remove specific packages from a dump file and translate them into a specified format.
2. Capture only N-th number of packets with tcpdump -c
When you run the tcpdump command, it gives you packages until you cancel the tcpdump command. Using the option -c you can specify the number of packets to capture.
$ tcpdump -c 2 -i eth0 listening on eth0, link-type EN10MB (Ethernet), capture size 65535 bytes 13: 01: 35.165898 ARP, Request who-has 213.159.211.80 tell gw.msk.ispsystem.net, length 46 13 : 01: 35..35123> wdc-ns1.ispsystem.net.domain: 7254+ PTR? 80.211.159.213.in-addr.arpa. (45) 2 packets captured 7 packets received by filter 0 packets dropped by kernel
Tcpdump command captured only 2 packets from eth0 interface.
Note:
Mergecap and TShark: Mergecap is a package dump merging tool that will combine multiple packages into one dump file. Tshark is a powerful network packet capture tool that can be used to analyze network traffic. It comes with Wireshark Network Distribution Analyzer.
3. Display captured packets in ASCII using tcpdump -a
The following tcpdump syntax prints the packet in ASCII.
$ tcpdump -A -i eth0 13: 03: 06.516709 IP 213.132.93.178..vlsi-lm: Flags [.], ack 3120779210, win 254, length 0 E .. ( [email protected]] ..... b ...%. = ... O.P ....... 13: 03: 06..35313> wdc-ns1.ispsystem.net.domain: 13562+ PTR? 178.93.132.213.in-addr.arpa. (45) [email protected]@ ........ x ..... 5.5 [filters]
In the official documentation (man tcpdump command), you can find several examples of using this utility for different cases, using quite diverse and complex filters.
It is also important to note that tcpdump (and indeed all packet analyzers) during its operation can generate huge amounts of information and greatly load the network, up to and including failures in its operation. Therefore, when analyzing traffic, you should use a rational approach - depending on the situation and conditions of the task (or problem), use filters, especially since this is a very effective part of the tcpdump functionality.
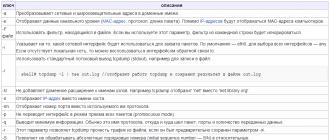
The most commonly used switches when running tcpdump are shown in the table
|
key |
description |
|
Converts network and broadcast addresses to domain names. |
|
|
Displays data link layer (MAC address, protocol, packet length). In addition to the IP addresses, the MAC addresses of the computers will be displayed. |
|
|
Use the filter provided in the file. If you use this parameter, the filter from the command line will be ignored. |
|
|
Indicates which network interface will be used to capture packets. The default is eth0, to select all interfaces is any. If there is no local network, then you can use the loopback interface lo. |
|
|
Use tcpdump's standard stream output (stdout), for example to write to a file: shell # tcpdump -l | tee out.log // will display the tcpdump operation and save the result in the out.log file |
|
|
Doesn't add domain extension to hostnames. For example tcpdump will display ‘net’ instead of ‘net.library.org’ |
|
|
Displays the IP address instead of the hostname. |
|
|
Displays the port number instead of the protocol it uses. |
|
|
Does not put the interface into promiscuous mode. |
|
|
Displays a minimum of information. Usually this is the name of the protocol, where the packet came from and where, the ports and the amount of data transferred. |
|
|
This option allows tcpdump to read traffic from a file if it was previously saved with the -w option. |
|
|
Allows you not to process absolute sequence numbers (initial sequence numbers - ISN) into relative ones. |
|
|
The number of packet bytes that tcpdump will process. If you set a large number of bytes to display, the information may not fit on the screen and may be difficult to study. Depending on what goals you are pursuing, and you should choose the value of this parameter. By default tcpdump captures the first 68 bytes (minimum 96 bytes for SunOS), but if you want to see the contents of the entire packet, use 1514 bytes (the maximum frame size on Ethernet). |
|
|
Doesn't display a timestamp on every line. |
|
|
Interpreting packets of a given type. The types aodv, cnfp, rpc, rtp, rtcp, snmp, tftp, vat, wb are supported. |
|
|
Displays an unformatted timestamp on each line. |
|
|
Shows the time along with the date. |
|
|
Detailed information output (TTL; ID; total length of the header, as well as its parameters; checks the checksums of IP and ICMP headers) |
|
|
The output is even more complete, mainly related to NFS and SMB. |
|
|
Display of the most detailed information. |
|
|
Saves tcpdump data in binary format. The advantages of using this method over regular file redirection are the high write speed and the ability to read similar data by other programs, such as snort, but this file cannot be read by humans. It is possible to output binary data to the console, for this you need to use -w - |
|
|
Makes a hexadecimal listing of the packet, useful for analyzing the packet in more detail. The amount of data displayed depends on the -s option |
|
|
-x but includes a link-layer header |
|
|
Outputs the packet in ASCII and hex format. It is useful in the case of analyzing a hacking incident, as it allows you to view what text information was transmitted during the connection. |
|
|
Same as previous parameter -X but includes a link-layer header. |
|
|
tcpdump will exit after receiving the specified number of packets. |
|
|
The collected packages will be immediately added to a file, otherwise they will accumulate in memory until it runs out |
Tcpdump filters
Filters are divided into the following classifications
host- host address
port- the port on which you want to catch packets
portrange - port range
net- network
Tcpdump net 192.168.0.0/24
capture of all traffic in which the source or destination is ip addresses from the 192.168.0.0/24 network
Tcpdump port 80
All traffic on port 80 will be captured.
Traffic direction in relation to the monitoring object
src- sender
dst- recipient
for example command
Src host 172.31.25.200
Capturing traffic from which the sender ip address is 172.31.25.200
Protocol
ether- basic network technology Ethernet, usually indicates that the hardware MAC address is used in the filter
ip- IPv4 protocol
ip6- IPv6 protocol
arp- ARP protocol
tcp- TCP protocol
udp- UDP protocol
If no protocol is specified, then traffic for all protocols will be captured
For example the command
Udp port 5060
traffic capture via udp protocol port 5060
Composite Filters
In order to more flexibly filter traffic, you can use logical operations
"And" - and (&&)
"OR" - or (||)
"NOT" - not (!) - value inversion
Moreover, the priority of these operations is as follows:
the highest priority is the inversion operation
then a logical "AND"
the lowest priority is the OR operation.
The priority of operations can be changed using parentheses.
(net 172.16.0.0/24 or host 172.31.0.5) and tcp port 80
capturing TCP traffic and using port 80 belonging to the network 172.16.0.0/24 or to the host 172.31.0.5, either to any host individually or together
(net 172.16.0.0/24 || host 172.31.0.5) && not tcp port 80
capturing any traffic except for TCP traffic and using port 80 belonging to the network 172.16.0.0/24 or host 172.31.0.5 either individually or together
tcpdump linux examples
Writing output to a file
$ sudo tcpdump -w sshtrace.tcpdump tcp port 22
The sshtrace.tcpdump file will be created by default in the home directory of the current user. To display information from the myrouter.tcpdump file, use the -r option:
$ tcpdump -r sshtrace.tcpdump
Remove all traffic from eth1 interface
$ tcpdump –i eth1
Remove traffic from a range of ports on interface eth1
$ tcpdump -i eth1 portrange 100-200
all traffic going to 172.16.0.1 that is not ICMP.
If you need to analyze or intercept network packets in Linux, then it is best to use the console utility for this. tcpdump... But the problem arises in its rather complex management. It will seem to an ordinary user that working with the utility is inconvenient, but this is only at first glance. This article will tell you how tcpdump works, what syntax it has, how to use it, and also give numerous examples of its use.
Read Also: Guides for Setting Up Internet Connection in Ubuntu, Debian, Ubuntu Server
Most Linux-based operating system developers include the tcpdump utility as preinstalled, but if for some reason it is not in your distribution, you can always download and install it via "Terminal"... If your OS is based on Debian, and this is Ubuntu, Linux Mint, Kali Linux and the like, you need to run this command:
sudo apt install tcpdump
When installing, you need to enter a password. Please note that it is not displayed when typing; you also need to enter the symbol to confirm the installation "D" and press Enter.
If you have Red Hat, Fedora or CentOS, the installation command will look like this:
sudo yam install tcpdump
After the utility is installed, you can use it immediately. This and much more will be discussed further in the text.
Syntax
Like any other command, tcpdump has its own syntax. Knowing it, you can set all the necessary parameters that will be taken into account when executing the command. The syntax is as follows:
tcpdump options -i interface filters
When using the command, you must be sure to specify the interface for tracking. Filters and options are optional variables, but they allow for more flexible customization.
Options
Although the option does not have to be specified, it is still necessary to list the available ones. The table shows not their entire list, but only the most popular ones, but they are more than enough to solve most of the tasks.
| Option | Definition |
|---|---|
| -A | Allows to sort packets with ASCII format |
| -l | Adds a scroll function |
| -i | After entering, you need to specify the network interface that will be monitored. To start tracking all interfaces, enter the word "any" after the option |
| -c | Ends the tracking process after checking the specified number of packets |
| -w | Generates a text file with a validation report |
| -e | Shows the internet connection level of the data packet |
| -L | Outputs only those protocols supported by the specified network interface |
| -C | Creates another file while writing a batch if its size is larger than the specified one |
| -r | Opens a file for reading that was created with the -w option |
| -j | TimeStamp format will be used to record packets |
| -J | Allows you to view all available TimeStamp formats |
| -G | Serves to create a file with logs. The option also requires specifying a temporary value, after which a new log will be created. |
| -v, -vv, -vvv | Depending on the number of characters in the option, the command output will become more detailed (increase in direct proportion to the number of characters) |
| -f | The output shows the domain name of the IP addresses |
| -F | Allows to read information not from the network interface, but from the specified file |
| -D | Demonstrates all network interfaces that can be used |
| -n | Disables display of domain names |
| -Z | Specifies the user under whose account all files will be created |
| -K | Skipping checksum analysis |
| -q | Demonstration of brief information |
| -H | Allows to detect 802.11s headers |
| -I | Used when capturing packets in monitor mode |
Having analyzed the options, a little below we will go directly to their applications. In the meantime, we will look at filters.
Filters
As mentioned at the very beginning of this article, you can add filters to the tcpdump syntax. The most popular of them will now be considered:
All of the above filters can be combined with each other, thus, in issuing a command, you will observe only the information that you want to see. To understand in more detail the use of the above filters, it is worth giving examples.
Examples of using
Frequently used tcpdump syntax variations will now be presented. It will not be possible to list all of them, since there can be an infinite number of their variations.
Viewing the list of interfaces
It is recommended that each user initially check the list of all their network interfaces that can be traced. From the above table, we know to use the option -D so in terminal run the following command:

As you can see, there are eight interfaces in the example that can be viewed using the tcpdump command. The article will provide examples with ppp0, you can use any other.
Normal traffic capture
If you need to track one network interface, then you can do this using the option -i... Do not forget to specify the name of the interface after entering it. Here is an example of executing such a command:
sudo tcpdump -i ppp0
Please note: before the command itself, you need to enter "sudo", since it requires superuser rights.

Note: after pressing Enter, the intercepted packets will be continuously displayed in the "Terminal". To stop their flow, you need to press the key combination Ctrl + C.
If you run the command without additional options and filters, you will see the following format for displaying tracked packets:
22: 18: 52.597573 IP vrrp-topf2.p.mail.ru.https> 10.0.6.67.35482: Flags, seq 1: 595, ack 1118, win 6494, options, length 594
Where the color is highlighted:
- blue - the time the package was received;
- green - the sender's address;
- purple - the recipient's address;
- gray - additional information about tcp;
- red - packet size (displayed in bytes).
This syntax has the ability to output in a window "Terminal" without using additional options.
Capturing traffic with the -v option
As you know from the table, the option -v allows you to increase the amount of information. Let's take an example. Let's check the same interface:
sudo tcpdump -v -i ppp0

Here you can see that the following line appears in the output:
IP (tos 0x0, ttl 58, id 30675, offset 0, flags, proto TCP (6), length 52
Where the color is highlighted:
- orange - protocol version;
- blue - protocol lifetime;
- green - the length of the field header;
- purple - tcp package version;
- red - packet size.
Also in the command syntax, you can write the option -vv or -vvv, which will further increase the amount of information displayed on the screen.
The -w and -r options
The options table mentioned the ability to save all output data to a separate file so that you can view it later. The option is responsible for this. -w... It is quite simple to use it, just specify it in the command, and then enter the name of the future file with the extension ".Pcap"... Let's consider everything with an example:
sudo tcpdump -i ppp0 -w file.pcap

Please note: while writing logs to a file, no text is displayed on the Terminal screen.
When you want to view the recorded output, you must use the option -r, after which write the name of the previously recorded file. It is applied without other options and filters:
sudo tcpdump -r file.pcap

Both of these options are great when you need to save large amounts of text for later parsing.
IP filtering
We know from the filter table that dst allows you to display to the console screen only those packets that were received by the address specified in the command syntax. This makes it very convenient to view the packages received by your computer. To do this, you just need to specify your IP address in the command:
sudo tcpdump -i ppp0 ip dst 10.0.6.67

As you can see, in addition to dst, in the command we also added a filter ip... In other words, we told the computer to pay attention to their IP address when selecting packets, and not to other parameters.
You can also filter outgoing packets by IP. In the example, we will give our IP again. That is, now we will track which packets are sent from our computer to other addresses. To do this, run the following command:
sudo tcpdump -i ppp0 ip src 10.0.6.67

As you can see, in the command syntax we have changed the filter dst on src, thereby telling the machine to look for the sender by IP.
Filtering by HOST
By analogy with IP in the command, we can specify a filter host to filter out packets with the host of interest. That is, in the syntax, instead of the sender / receiver IP address, you will need to specify its host. It looks like this:
sudo tcpdump -i ppp0 dst host google-public-dns-a.google.com

The image shows that in "Terminal" only those packets are displayed that were sent from our IP to the host google.com. As you can understand, instead of the google host, you can enter any other.
As with IP filtering, in the syntax dst can be replaced with src to see the packets that are being sent to your computer:
sudo tcpdump -i ppp0 src host google-public-dns-a.google.com
Please note: the host filter must come after dst or src, otherwise the command will generate an error. In the case of IP filtering, in contrast, dst and src come before the ip filter.
Applying the and and or filter
If you need to use several filters at once in one command, then for this you need to apply the filter and or or(depends on the case). By specifying filters in syntax and separating them with these operators, you "make" them work as one. For example, it looks like this:
sudo tcpdump -i ppp0 ip dst 95.47.144.254 or ip src 95.47.144.254

From the command syntax, you can see what we want to display on the screen "Terminal" all packets that were sent to the address 95.47.144.254 and packets received at the same address. Also you can change some of the variables in this expression. For example, instead of IP, specify HOST or replace the addresses themselves.
Port and portrange filter
Filter port perfect when you need to get information about packets with a specific port. So, if you only need to see responses or DNS queries, you need to specify port 53:
sudo tcpdump -vv -i ppp0 port 53

If you want to view http packages, you need to enter port 80:
sudo tcpdump -vv -i ppp0 port 80

Among other things, it is possible to trace the range of ports at once. For this, a filter is applied portrange:
sudo tcpdump portrange 50-80

As you can see, in conjunction with a filter portrange it is not necessary to specify additional options. You just need to set the range.
Filtering by protocol
You can also display only traffic that matches a protocol. To do this, you need to use the name of this protocol itself as a filter. Let's look at an example udp:
sudo tcpdump -vvv -i ppp0 udp

As you can see in the image, after executing the command in "Terminal" only packets with protocol were displayed udp... Accordingly, you can filter by others, for example, arp:
sudo tcpdump -vvv -i ppp0 arp
or tcp:
sudo tcpdump -vvv -i ppp0 tcp
Filter net
Operator net helps filter packets based on their network designation. It is as easy to use as the others - you need to specify the attribute in the syntax net and then enter the network address. Here's an example of such a command:
sudo tcpdump -i ppp0 net 192.168.1.1

Filter by packet size
We haven't covered two more interesting filters: less and greater... From the table with filters, we know that they serve to output data packets more ( less) or less ( greater) of the size specified after the attribute was entered.
Suppose we only want to monitor packets that do not exceed the 50-bit mark, then the command will look like this:
sudo tcpdump -i ppp0 less 50

Now let's map to "Terminal" packets larger than 50 bits:
sudo tcpdump -i ppp0 greater 50

As you can see, they are applied in the same way, the only difference is in the name of the filter.
Conclusion
At the end of the article, we can conclude that the command tcpdump is a great tool with which you can track any data packet transmitted over the Internet. But for this it is not enough just to enter the command itself into "Terminal"... You can only achieve the desired result if you use all sorts of options and filters, as well as their combinations.