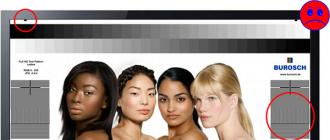
A test picture with several test zones is used here. With this image, you can adjust the five basic parameters of the image on the TV screen or monitor. The Ladies image is in the set of test images, the link to the sweep will be at the bottom of the article.
Before adjusting, you must turn off all enhancers and other functions on the TV that affect the image. The image can be connected via USB from a flash drive, if you use another source, for example, a computer, then look at the correspondence of the signal parameters at the source output and at the TV input. The size, scan and frame rate must be the same. You also need to install the TV in the place where it will constantly work and turn on the light source that will work when watching the TV set.
This test has several zones that can serve as a visual reference for the image. To get the best picture quality on your TV, you only need to make these five settings:
- Aspect ratio, screen boundaries.
- Brightness.
- Contrast.
- Colour.
- Clarity (focus).
Adjusting the borders of the image (overscan)
In the picture, you can see tips (arrows) at the edges, so these arrows should be fully visible and the tips just touch the edge of the screen. If the size is incorrectly set, not only will the image be cropped, but the clarity will also decrease. On the TV, the menu items affecting the picture boundaries (Zoom) can be called: pixel to pixel, Full Pixel, Just Scan, Pixel-to-Pixel, Original, Overscan, etc.

Below are pictures of how an incorrectly selected scaling can affect the clarity of the picture:


Brightness
With the correct brightness setting, look at the grayscale at the top of the Ladies picture. All 32 shades should be visible and have a clear border.
In the figures below, the areas where the incorrect brightness setting is visible are outlined in red. Or the brightness is too low, then the black grayscale merges into one. Or the brightness is large and the grayscale in the light areas merges.


Contrast
After adjusting the brightness, we look at the same gray scale. If in the light areas we see the merging of individual areas into one, then adjust the contrast in the TV. With the correct settings, we should see all 32 grayscale sections. As you can see, an incorrect contrast setting affects the display of human skin. When the contrast level is too high, areas with a negative appear on the skin.

Sometimes it happens that after adjusting the contrast, you need to go back to adjusting the brightness and then check the contrast again.
The following picture shows the TV's contrast level is too low.

Colour
The display quality of human skin is very indicative for the correct color adjustment. It is necessary to find a balance when everything is correct with the color in the dark areas and the light areas will not be dull. Sometimes for image quality it is better to set a lower color saturation, it will be more natural. Of course, too low color should be avoided.


When adjusting the color, you still need to make sure the quality of the white color. The areas of the test pattern where there is white should be white. If there is any color cast, then it is wrong.
Also notice the small contrasting areas on the color bar. You should see them, they are controlled by color saturation. These squares should stand out against the background.
Definition
The clarity of the image can be checked well in the area where the two stripes intersect. These lines should appear without halos or shadows. Typically, the factory default settings are already correct and rarely need to be adjusted at home.

Gamma
This adjustment parameter is not found in every TV. But if it is, then you need to check its correct setting. To check the gamut, a color stripe and an image of girls are used.

Conclusion
It is necessary to carry out such settings immediately after purchasing the TV. Still, there are situations when the device is so bad that any adjustments cannot improve the image quality.
To help you determine the resolution of video cameras, as well as to check other components of the video system, a special test chart has been developed.
We have tried to make it as accurate and informative as possible, and while it can be used to test broadcast equipment, it should not be considered a substitute for the various test charts designed for broadcast TV. This table should only be used for CCTV systems and as a guide for comparing different equipment and / or transmission media.
The table presented in this article has been modernized and has several differences from the table in the previous edition. The additions are mainly concerned with white lines, which will allow you to check if a person can be recognized at a certain distance. This procedure is based on the recommendations of the VBG (Verwaltungs-Berufsgenossenschaft): Installationshinweise fur Optische Raumuber-wachungs-anlagen (ORUA) SP 9.7 / 5.
Using this table, you can check many other parameters of the video signal, primarily the resolution, but also the bandwidth, linearity of the video monitor, gamma correction, color reproduction, load matching and reflection.
Before you start testing
The first thing you should do to improve the quality of your camcorder's image is to choose a very good lens (the resolution of which is much higher than that of the CCD itself). To control the optical resolution of lenses, fixed focal length lenses with manual iris are the best choice.
Short throw lenses with angles of view over 30 degrees should be avoided as they can produce spherical distortion. A good choice for a 1/2 "CCD camcorder would be 8, 12, 16 or 25mm lenses. For a 1/3" CCD camcorder, 8, 12, or 16mm lenses are better.
A longer focal length will force you to mount the camcorder further away from the test chart. A photographic tripod is recommended for this purpose.
For testing the resolution of a video camera, it is better to choose a high quality black and white video monitor, since its resolution reaches 1000 TVL in the center.
Color videos monitors are acceptable only if their quality matches or is close to the quality of broadcast television video monitors. To meet this quality, a video monitor must have a horizontal resolution of at least 500 TVL. It is clear that black-and-white video cameras with a horizontal resolution of more than 500 TVL cannot be tested using such video monitors, but they are quite suitable for testing most color video cameras (with a resolution of up to 480 TVL).
Installation procedure
Place the chart perpendicular to the optical axis of the lens. The video camera should "capture" the table in full, exactly up to the yellow triangular arrows. To do this, you must switch the video monitor to "undescan" mode, and then you will see 100% of the image.

If you do not have such a video monitor, then the dotted line around the perimeter of the table indicates a 10% narrowing of the view - this is close to what a regular video monitor would show. However, for permission checks, this is not entirely accurate. If you only have a standard video monitor, there is a little trick you can do.
 Mount the camcorder on a tripod as close as possible to display the entire table. Set the V-hold control on the video monitor so that the vertical blanking pulse (horizontal black bar between the TV fields) is visible. You should set V-hold to such a position to get a stable horizontal bar somewhere in the middle of the screen. Then try to adjust the position of the camcorder on the tripod and / or lens so that the top and bottom positional triangles of the test chart touch the border of the black bar. Once you have adjusted the vertical position of the video camera, you can easily adjust the horizontal position as well, since the image of the test chart is in the middle of the video monitor screen. Now, and only now, can you take accurate data from the test table.
Light the table with two opaque incandescent bulbs (about 60W each) on both sides so that there is no glare on the table. It would be nice if the lamps have dimmers, since in this case you could check the minimum illumination of the camcorder. Naturally, in this case, this procedure should be carried out indoors without additional light. If you need to test the camcorder's performance at low light levels, you will need to purchase an accurate light meter. (This method of measuring the minimum illumination will not provide high measurement accuracy, since adjusting the brightness of incandescent lamps changes their emission spectrum. Ed.)
Mount the camcorder on a tripod or bracket at a distance that allows you to clearly see the entire test chart. Make sure the tips of the arrows touch the edges of the full image or the black horizontal stripe if you are using the alternative method above.


Set the lens aperture to the middle position (F / 5.6 or F / 8) as this is the best optical resolution for most lenses, and then adjust the light to obtain the full dynamic range of the video signal. To do this, you need an oscilloscope. Do not forget to turn off all video processing circuits in the tested video camera, i.e. AGC, electronic shutter, backlight compensation (BLC).
Make sure the load is matched, that is, the camcorder is loaded into 75 ohms at the end of the coaxial line.
What can you test?
To check the resolution of the video camera (vertically or horizontally), you must determine the point at which the four lines inside the circle, forming a sharp triangle, merge into three. This is the point that corresponds to the limit value of the resolution; it can be read from the table. A line-selectable oscilloscope is required to determine the horizontal resolution more accurately, as with broadcast equipment.
 If you need to check the video bandwidth, read the megahertz value next to the last clear group of lines where you can see black and white lines.
The fine concentric lines in the center of the test pattern square can be used to adjust focus and / or back focus. Check the exact distance between the camera and the test chart before starting the adjustment. In most cases, this distance should be measured to the plane of the CCD. Although some lenses indicate the distance relative to the front of the lens.
Replaying the circle will show you the linearity of the video monitor only, since CCD cameras are not geometrically distorted due to their design. Sometimes linearity is easier to check by measuring the vertical and horizontal length of the 6 x 6 squares to the left of the focus square.
The wide white and black stripes on the left side have a double function. Firstly, they will show you if the characteristic impedance is matched or there is a signal reflection, that is, if white floats into black (and vice versa) is a sign of signal reflection from the end of the line. These same strips can be used to test long cable quality, VCR playback, and other transmission or playback media. Second, you can determine if the camera / lens combination provides enough detail to recognize activity (intrusion or attack). To do this, the video camera should be positioned at such a distance that it can see a 3 m wide area in the plane of the test chart. If at the same time you can distinguish between the stripes, then the combination of video camera / lens you choose is good at detecting activity. It is clear that if it is possible to distinguish between the stripes near the number 1, then this is better than in the case of the stripes with the number 2.
The white slanted stripes on the right side have a function similar to the thinner stripes on the left side. If you can distinguish the lines next to the green letter C, or, even better, with the letters B and A, when the video camera is at a distance that allows you to see an area 1 m wide in the plane of the table, then you will be able to recognize a person at the same distance. A is better than B, and B is better than C. This test can be used to determine whether the selected camera / lens combination provides sufficient image detail. Even more valuable and informative is the evaluation of the playback quality of the hard disk recorder, since there are no objective methods for determining the quality of compression / decompression in CCTV.
A color photograph of three kids will give you a good flesh color indicator, so if you are using a color camcorder, you can check the color temperature of the light source and the camcorder's auto white balance, if available. In this case, the color temperature of the light source must be taken into account, which in the case of an incandescent lamp is 2800 ° K.
For a more accurate color test of your camcorder, use the scale at the top of the test chart. The colors of this scale correspond to the color bars produced by a conventional TV test generator. If you have a vectorscope, you can check the color reproduction on a single scan line of color bars. As with any color reproduction system, the color temperature of the source is of great importance and in most cases it should be natural light.
The gray background exactly corresponds to 30% gray and, together with the grayscale at the bottom, can be used to check the gamma correction of the video camera / monitor system. The grayscale is linear, in contrast to some logarithmic scales. The linear scale was chosen because most modern camcorders have a linear response, making it easier to adjust different levels on an oscilloscope. The grayscale can also be used to set the optimal contrast / brightness for the video monitor.
To get the best setting for your video monitor, do the following.
Examples of
Universal Electronic Test Chart (UEIT)
Designed for testing color TVs operating in the SECAM standard with a screen aspect ratio of 4: 3. UEIT was developed by the candidate of technical sciences N.G.Deryugin and the engineer of the State Research Institute of Radio (NIIR) V.A.Minaev. The informal name is "color prophylaxis table" (TCP). Experimental broadcasts from the Ostankino TV Tower (at that time - the All-Union Radio and Television Transmitting Station named after the 50th anniversary of October, ORPS) began in 1970. Based on their results, the table was finalized, and since 1971, the second version, UEIT-2, was broadcast on the air and via communication lines. Main parts:
- The grid field is the background of the table. Allows you to customize the convergence of rays, and also visually breaks the table into rows and columns. In the center of the large circle there is an additional crosshair for centering the image and also for adjusting static convergence, and in small ones - as a reference point for adjusting dynamic convergence;
- Table border - fiducial marks for setting the image size;
- Circles to control the geometric distortion of the raster. To check the accuracy of the aspect ratio adjustment, you can measure the side lengths of the square in the center;
- Color bars at 75% saturation (lines 6-7) and 100% (lines 14-15) for color control. If you have an oscilloscope with the selection of individual lines, it is possible to adjust by them instead of a separate color bar generator;
- Gray scale (8th line) - to set brightness, contrast, white balance and black level;
- Contrasting color stripes (line 9) to adjust the clarity of color transitions;
- Smooth color transition (12 lines) to check the linearity of the chroma channel. In some implementations there is a full spectrum, in others there is a transition from green to magenta;
- Vertical strokes on the 13th line, as well as in the small circles (lines 3,4,17,18) for evaluating the resolution and dynamic focusing. They are formed by packs of sinusoidal signals with a frequency of 2,3,4 and 5 MHz, corresponding to a resolution of 220, 330, 440 and 550 lines.
- Oblique stripes in 10-11 lines for control of interlaced accuracy;
- Contrast marks in the same lines to control stretching continuations (caused by a malfunction of the TV's circuits and also when several TVs are connected via a video output via a low-quality cable) and repetitions (caused by an unsuccessful design or location of the antenna);
- Alternating black and white squares (line 16) - for evaluating the frequency response of the video path for all channels;
TIT-0249
A black and white test chart designed in 1949. There were two ways of transmitting TIT-0249: shooting with a TV camera from a graphic original or reproduction using a monoscope. Currently, it is practically not used by TV channels, but sometimes it is used to assess the resolution of video cameras.
TIT-0154
This table was created in 1954 specifically for the then experimental color television system with sequential color transmission. It is described in and. The use of this table, like the experimental system itself, was soon discontinued.
EIA Resolution Chart
Developed in 1956 and has become a kind of test chart standard
Notes (edit)
Links
- TV test chart- article from the Great Soviet Encyclopedia
- Tables for testing the resolution of CCTV cameras
- GOST 14872-82 Optical television test tables. Types, sizes and specifications
see also
Wikimedia Foundation. 2010.
See what "TV test chart" is in other dictionaries:
Table for visual control of the quality of the TV. Images. For black-and-white TV images in the USSR, T. and. t. 0249 (see fig.), which allows you to determine its clarity (depending on the resolution of the TV channel or included in it ... Big Encyclopedic Polytechnic Dictionary
TV test chart- test table Normalized image, the elements of which are used to control and evaluate the parameters and characteristics of the image of the broadcast television path or links of the broadcast television path. [GOST 21879 88] Topics ... ...
A special image reproduced on a picture tube screen for adjusting television equipment and assessing the quality of a television image. It is a slide, a drawing (for example, on the target of a monoscope) or is formed electrically (in ... Big Encyclopedic Dictionary
TV test chart- 143. Television test pattern Test pattern D. Fernsehtestbild E. Television test pattern F. Mire de télévision Normalized image, the elements of which are used to control and evaluate the parameters and characteristics of the image ... ... Dictionary-reference book of terms of normative and technical documentation
A special image reproduced on a picture tube screen for adjusting television equipment and assessing the quality of a television image. Represents a slide, a drawing (for example, on the target of a monoscope) or formed electrically ... encyclopedic Dictionary
TV test chart- tikrinamoji televizijos lentelė statusas T sritis radioelektronika atitikmenys: angl. television chart; television test pattern vok. Fernsehtestbild, n rus. TV test chart, f pranc. mire de télévision, f ... Radioelektronikos terminų žodynas
The test table is used to control the parameters that characterize the quality of the television image. T. and. t. is performed on a special card, on a transparency, in the form of a frame on film or applied to an aluminum plate of the Monoscope. ... ... Great Soviet Encyclopedia
- (test table), the image of a drawing, as a rule, having the form of various geometric figures of a known shape, brightness and color placed in a certain order, which serve to assess the quality of a television channel (including TV) and ... ... Encyclopedia of technology
TV test chart- 1. Normalized image, the elements of which are used to control and evaluate the parameters and characteristics of the image of the broadcast television path or links of the broadcast television path Used in the document: GOST 21879 88 Television ... Telecommunication vocabulary
digital TV test chart- Normalized image, the elements of which are used to assess the parameters and characteristics of the television image at the output of the digital channel of broadcast television or its parts. Note The table can be electronic, optical and ... ... Technical translator's guide
TV test chart(test table) - a special image reproduced on the kinescope screen for adjusting and assessing the image quality of television equipment, as well as all kinds of displays (including computer monitors).
Examples of
Universal Electronic Test Chart (UEIT)
- The grid field is the background of the table. Allows you to customize the convergence of rays, and also visually breaks the table into rows and columns. In the center of the large circle there is an additional crosshair for centering the image and also for adjusting static convergence, and in small ones - as a reference point for adjusting dynamic convergence;
- Table border - fiducial marks for setting the image size;
- Circles to control the geometric distortion of the raster. To check the accuracy of the aspect ratio adjustment, you can measure the side lengths of the square in the center;
- Color bars at 75% saturation (lines 6-7) and 100% (lines 14-15) for color control. If you have an oscilloscope with the selection of individual lines, it is possible to adjust by them instead of a separate color bar generator;
- Gray scale (8th line) - to set brightness, contrast, white balance and black level;
- Contrasting color stripes (line 9) to adjust the clarity of color transitions;
- Smooth color transition (12 lines) to check the linearity of the chroma channel. In some implementations there is a full spectrum, in others there is a transition from green to magenta;
- Vertical strokes on the 13th line, as well as in small circles (lines 3,4,17,18) for evaluating the resolution and dynamic focusing. They are formed by packs of sinusoidal signals with a frequency of 2,3,4 and 5 MHz, corresponding to a resolution of 220, 330, 440 and 550 lines.
- Oblique stripes in 10-11 lines for control of interlaced accuracy;
- Contrast marks in the same lines to control stretching continuations (caused by a malfunction of the TV outlines, as well as when several TVs are connected via a video output through a low-quality cable) and repetitions (caused by an unsuccessful design or location of the antenna);
- Alternating black and white squares (line 16) - for evaluating the frequency response of the video path for all channels;