Open a command prompt window (as an administrator). In the Start\Search box, type "cmd", then right-click "cmd.exe" and select "Run as administrator"
Type the following text and press Enter.
netstat-abno
-a Displays all connections and listening ports.
-b Displays the executable involved in creating each connection or listening port. In some cases, a known host executable has several independent components, and in these cases a sequence of components involved in creating a connection or listening port. In this case, the executable's name is at the bottom, at the top is the component it named, and so on. until TCP/IP is reached. Please note that this option can take a long time and will fail if you don't have enough permission.
-n Displays addresses and port numbers in numerical form.
-o Displays the ownership process ID associated with each connection.
Find the port you are listening on under "Local Address"
Look at the process name directly below that.
NOTE. To find a process in Task Manager
If you don't see the PID column, click View/Select Columns. Select a PID.
Make sure "Show processes from all users" is selected.
Notice the process id (process id) next to the port you are looking for.
Open Windows Task Manager.
Go to the Processes tab.
Look at the PID you noted when you did netstat in step 1.
Hello everyone, earlier I started a story about the network utilities of the system administrator in the article "The pathping utility or how to diagnose a problem on the route to the site. Network utilities part 3", move on and analyze another utility netstat or how to determine which ports your computer is listening on. This program will be an indispensable tool in the software luggage of any system engineer, it will help him to quickly diagnose the situation and detect a number of various problems with services and their availability.
netstat commands
netstat- Displays active TCP connections, ports listening on the computer, Ethernet statistics, IP routing table, IPv4 statistics (for IP, ICMP, TCP and UDP protocols) and IPv6 (for IPv6, ICMPv6, TCP over IPv6 and UDP over IPv6 protocols)
Imagine a situation where you installed, for example, the MSM LSI utility to view the RAID controller parameters, run the utility, but it doesn’t find anything, because the port is closed and which one you don’t know, and it’s not always possible to quickly find information about it on the Internet, for this you can run netstat and see which port your server with the MSM process is listening on.
Open a Windows command prompt and type netstat?. Help for the utility will pop up.

C:\Users\sem>netstat ?
Displays protocol statistics and current TCP/IP network connections.
NETSTAT [-a] [-b] [-e] [-f] [-n] [-o] [-p protocol] [-r] [-s] [-x] [-t]
[interval]
- -a Display all connections and listening ports.
- -b Display the executable involved in the creation
- each connection or listening port. Sometimes well-known executables contain many independent components. The sequence of components involved in creating a connection or listening port is then displayed. In this case, the name of the executable is in parentheses at the bottom, the component it called is at the top, and so on until TCP/IP is reached. Note that this approach can take a long time and requires sufficient permissions.
- -e Display Ethernet statistics. Can be used in conjunction with the -s option.
- -f Display fully qualified domain name () for external addresses.
- -n Display addresses and port numbers in numeric format.
- -o Display the process ID of each connection.
- -p protocol Display connections for the protocol specified by this option. Valid values are TCP, UDP, TCPv6, or UDPv6. When used with the -s option to display protocol statistics, valid values are: IP, IPv6, ICMP, ICMPv6, TCP, TCPv6, UDP, or UDPv6.
- -r Display the contents of the route table.
- -s Display statistics by protocol. By default, statistics are displayed for IP, IPv6, ICMP, ICMPv6, TCP, TCPv6, UDP, and UDPv6 protocols. The -p option allows you to specify a subset of the output.
- -t Display the offload status for the current connection.
- -x Display connections, listeners, and shared NetworkDirect endpoints.
- -y Display the TCP connection template for all connections. Cannot be used in conjunction with other options. interval Redisplays the selected statistics with a pause between displays specified by the interval in seconds. To stop re-displaying statistics, press CTRL+C. If this parameter is omitted, netstat will print the current configuration information once.
Let's see the interesting keys of the netstat utility. The first thing we enter
and we will see the statistics of ethernet network packets on the screen.

If we add the -s key, we will get statistics on protocols.


It is very useful to see everything that your host is listening to, for this we write
The output of the command contains the protocol type, either TCP or UDP, the local address with the port on which it is listening, and the external address with the port, and the status of the action.
To fully understand the information provided by this command, you must understand the principles of establishing a connection in the TCP/IP protocol. Here are the main steps in the process of establishing a TCP/IP connection:
1. When trying to establish a connection, the client sends a SYN message to the server.
2. The server responds with its own SYN message and an acknowledgment (ACK).
3. The client then sends an ACK message back to the server, completing the connection setup process.
The disconnection process consists of the following steps:
1. The client communicates "I'm done" by sending a FIN message to the server. At this stage, the client only receives data from the server, but does not send anything itself.
2. The server then sends an ACK message and sends its own FIN message to the client.
3. The client then sends an ACK message to the server, acknowledging the FIN server's request.
4. When an ACK message is received from the client, the server closes the connection.
Understanding the steps in the process of setting up and breaking a connection allows you to more transparently interpret connection states in the output of the netstat command. Connections in the list can be in the following states.
- CLOSE_WAIT- Indicates the passive connection close phase that begins after the server receives a FIN message from the client.
- CLOSED- the connection is interrupted and closed by the server.
- ESTABLISHED- the client has established a connection with the server by receiving a SYN message from the server.
- FIN_WAIT_1- the client has initiated a connection close (sent a FIN message).
- FIN_WAIT_2- the client has received ACK and FIN messages from the server.
- LAST_ACK- The server sent a FIN message to the client.
- LISTEN- the server is ready to accept incoming connections.
- SYN_RECEIVED- the server received a SYN message from the client and sent a response to it.
- TIMED_WAIT- the client has sent a FIN message to the server and is waiting for a response to this message.
- YN_SEND- the specified connection is active and open.

The netstat utility or how to determine which ports your computer is listening on. Network utilities 4 part-06
There are many different applications that show which application is currently "listening" on which port. You can use SysInternals Process Explorer, Sysinternals TCPView, Nirsoft CurrPorts, all of which are great, but they may not be available at the right time. Their absence can be compensated by the built-in tools of the operating system.
Part Windows console utility included netstat. Run it with the parameter /? , you will see that it is intended to display statistics and active connections of the TCP / IP protocol, as well as a complete list of its options:
From this list, we are primarily interested in these:
- -a– display all connections and used ports.
- -o– display the numeric identifier of the process responsible for a particular connection (Process ID, or simply PID).
I also want to draw your attention to the option –n, which tells the utility netstat display real IP addresses and digital port values instead of DNS names and common aliases. In some cases this may be useful.
Procedure

If you are sick of tasklist, you can use the system " Task Manager". Run it by pressing CTRL+SHIFT+ESC, go to the "Processes" tab. In the "View" menu, select "Select Columns", and check the PID column: 
The desired process can be found by the value of this column: 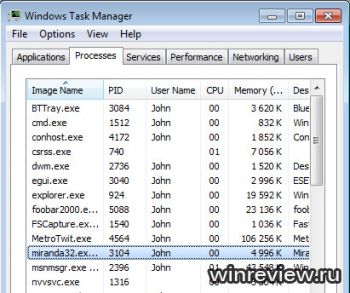
I personally prefer tasklist for the reason that there is no search in the task manager.
Team netstat, which is part of the standard UNIX network toolkit, displays various network-related information such as network connections, interface statistics, routing tables, masquerade, multicast, and so on.
In this article, we will look at ten practical examples of using the command netstat on linux.
1. List of all ports (both listening and not)
List all ports: netstat -a
# netstat -a | more Active Internet connections (servers and established) Proto Recv-Q Send-Q Local Address Foreign Address State tcp 0 0 localhost:domain *:* LISTEN udp6 0 0 fe80::20c:29ff:fe68:ntp [::]:* Active UNIX domain sockets (servers and established) Proto RefCnt Flags Type State I-Node Path unix 2 [ ACC ] STREAM LISTENING 20492 /var/run/mysqld/mysqld.sock unix 2 [ ACC ] STREAM LISTENING 23323 /var/run/php5-fpm.sock
List all TCP ports: netstat -at
# netstat -at Active Internet connections (servers and established) Proto Recv-Q Send-Q Local Address Foreign Address State tcp 0 0 localhost:domain *:* LISTEN tcp 0 0 *:ssh *:* LISTEN tcp 0 0 localhost:ipp *:* LISTEN tcp 0 0 *:http *:* LISTEN
List all UDP ports: netstat -au
# netstat -au Active Internet connections (servers and established) Proto Recv-Q Send-Q Local Address Foreign Address State udp 0 0 localhost:domain *:* udp 0 0 *:bootpc *:* udp6 0 0 fe80::20c:29ff:fe68:ntp [::]:*
2. List of sockets in LISTEN state
List all listening ports: netstat -l
# netstat -l Active Internet connections (only servers) Proto Recv-Q Send-Q Local Address Foreign Address State tcp 0 0 localhost:domain *:* LISTEN tcp6 0 0 [::]:ssh [::]:* LISTEN udp 0 0 192.168.128.134:ntp *:*
List TCP listening ports: netstat -lt
# netstat -lt Active Internet connections (only servers) Proto Recv-Q Send-Q Local Address Foreign Address State tcp 0 0 localhost:domain *:* LISTEN tcp 0 0 localhost:ipp *:* LISTEN tcp6 0 0 [::]:ssh [::]:* LISTEN
List listening UDP ports: netstat -lu
# netstat -lu Active Internet connections (only servers) Proto Recv-Q Send-Q Local Address Foreign Address State udp 0 0 *:bootpc *:* udp6 0 0 [::]:ntp [::]:*
List UNIX sockets listening: netstat -lx
# netstat -lx Active UNIX domain sockets (only servers) Proto RefCnt Flags Type State I-Node Path unix 2 [ ACC ] STREAM LISTENING 3141 /var/run/fail2ban/fail2ban.sock unix 2 [ ACC ] STREAM LISTENING 20492 /var/run/mysqld/mysqld.sock unix 2 [ ACC ] STREAM LISTEN ING 23323 /var/run/php5-fpm.sock
3. View statistics for each protocol
Show statistics of all ports: netstat -s
# netstat -s Ip: 11150 total packets received 1 with invalid addresses 0 forwarded 0 incoming packets discarded 11149 incoming packets delivered 11635 requests sent out Icmp: 13791 ICMP messages received 12 input ICMP message failed. Tcp: 15020 active connections openings 97955 passive connection openings 135 failed connection attempts Udp: 2841 packets received 180 packets to unknown port received. .....
Show statistics of TCP ports only: netstat -st
# netstat -st
Show statistics of UDP ports only: netstat -su
# netstat -su
4. Display PID and process name in netstat output
Option netstat -p will add "PID/Program Name" to the netstat output, and can be combined with any other set of options. This is very useful when debugging, to determine which program is running on a particular port.
# netstat -pt Active Internet connections (w/o servers) Proto Recv-Q Send-Q Local Address Foreign Address State PID/Program name tcp 0 0 org-ru-putty.vm.udf:www 52-106.plus.kerch:55723 ESTABLISHED 9486/nginx: worker tcp 0 0 org-ru-putty.vm.udf:www 52-1 06.plus.kerch:55757 ESTABLISHED 9486/nginx: worker
5. Name resolution in netstat output
When you don't need to resolve hostname, portname, username, use the option netstat -n to display values in digital format. The command will show IP address instead of host, port number instead of port name, UID instead of username.
This will also speed up the output, as netstat won't do unnecessary lookups.
# netstat -an
To display numerical values for only some of these items, use the following commands:
# netsat -a --numeric-ports # netsat -a --numeric-hosts # netsat -a --numeric-users
6. Output netstat information continuously
Option netstat -c will display information continuously, in the style top, refreshing the screen every few seconds.
# netstat -c Active Internet connections (w/o servers) Proto Recv-Q Send-Q Local Address Foreign Address State tcp 0 0 org-ru-putty.vm.udf:www 182.131.74.202:59933 FIN_WAIT2 tcp 0 0 org-ru-putty.vm.udf:www 182.131.74.202:6376 1 FIN_WAIT2 tcp 0 0 org-ru-putty.vm.udf:www 92-181-66-102-irk.:4585 ESTABLISHED ^C
7. Unsupported address families
Option netstat --verbose will show detailed output, and at the very end will display unsupported Address Family.
netstat: no support for `AF IPX" on this system. netstat: no support for `AF AX25" on this system. netstat: no support for `AF X25" on this system. netstat: no support for `AF NETROM" on this system.
8. Kernel Routing
Show kernel routing table: netstat -r
# netstat -r Kernel IP routing table Destination Gateway Genmask Flags MSS Window irtt Iface default 192.168.128.2 0.0.0.0 UG 0 0 0 eth0 192.168.128.0 * 255.255.255.0 U 0 0 0 eth0
Note: Use netstat -rn to view the route in digital format without resolving hostnames.
9. Matching Ports and Processes
Find out which port is occupied by a certain program:
# netstat -ap | grep ssh (Not all processes could be identified, non-owned process info will not be shown, you would have to be root to see it all.) tcp 0 0 *:ssh *:* LISTEN - tcp6 0 0 [::]:ssh [::]:* LISTEN -
Find out which process is using a particular port:
# netstat -an | grep ":80"
10. Network interfaces
Show list of network interfaces: netstat -i
# netstat -i Kernel Interface table Iface MTU Met RX-OK RX-ERR RX-DRP RX-OVR TX-OK TX-ERR TX-DRP TX-OVR Flg eth0 1500 0 1911037 0 0 0 1382056 0 0 0 BMRU lo 16436 0 0 0 0 0 0 0 0 0 LRU
Show extended information about interfaces (similar to ifconfig): netstat -ie
# netstat -ie Kernel Interface table eth0 Link encap:Ethernet HWaddr 00:0c:29:68:4c:a4 inet addr:192.168.128.134 Bcast:192.168.128.255 Mask:255.255.255.0 inet6 addr: fe80::20c:29ff:fe68:4ca4/ 64 Scope:Link UP BROADCAST RUNNING MULTICAST MTU:1500 Metric:1 RX packets:24278 errors:0 dropped:0 overruns:0 frame:0 TX packets:11275 errors:0 dropped:0 overruns:0 carrier:0 collisions:0 txqueuelen:1000 RX bytes:33203025 (33.2 MB) TX bytes: 665822 (665.8 KB) Interrupt:19 Base address:0x2000
11. netstat -lnptux
Let's summarize the above and combine the keys into one useful command that will show:
- -l all open ports (LISTEN)
- -t over TCP
- -u over UDP protocol
- -x over UNIX Socket protocol
- -n without resolving IP/names
- -p but with process names and PIDs
Note: Not all processes can be identified by the last key, foreign processes will not be shown. You must be root to see everything.
# netstat -lnptux Active Internet connections (only servers) Proto Recv-Q Send-Q Local Address Foreign Address State PID/Program name tcp 0 0 0.0.0.0:80 0.0.0.0:* LISTEN 9614/nginx tcp 0 0 0.0.0.0:22 0.0.0.0:* LISTEN 601/sshd udp 0 0 8.8.4.4:123 0.0.0.0:* 574/ntpd udp 0 0 127.0.0.1:123 0.0.0.0:* 574/ntpd udp 0 0 0.0.0.0:123 0.0.0.0:* 574/ntpd Cnt Flags Type State I-Node PID/Program name Path unix 2 [ ACC ] STREAM LISTENING 4233 826 160413 7301/php-fpm.conf /var/run/php5-fpm.sock
January 2013, website
Please enable JavaScript© 2009–2019, site - When using site materials, indicate the source.