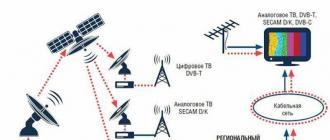
Computer graphics is a field of computer science that deals with algorithms and technologies for data visualization. The development of computer graphics is mainly determined by two factors: the real needs of potential users and the capabilities of hardware and software. The needs of consumers and the capabilities of technology are steadily growing, and today computer graphics are actively used in various fields. The following areas of application of computer graphics can be distinguished:
- Information visualization.
- Modeling of processes and phenomena.
- Design of technical objects.
- Organization of the user interface.
Information visualization
Most scientific articles and reports cannot do without data visualization. A decent form of data presentation is a well-structured table with the exact values \u200b\u200bof a function depending on some variables. But often a more visual and effective form of data visualization is a graphical one, and, for example, in modeling and image processing, it is the only possible one. Some types of display of information of different origins are listed in the following table:
Many programs for financial, scientific, technical calculations use these and some other methods of data visualization. Visual presentation of information is an excellent tool for scientific research, a clear and compelling argument in scientific articles and discussions.
Modeling processes and phenomena
Modern graphics systems are powerful enough to create complex animations and dynamic images. Simulation systems, also called simulators, try to obtain and visualize a picture of the processes and phenomena that occur or could occur in reality. The most famous and most complex example of such a system is a flight simulator, which is used to simulate the situation and the flight process when training pilots. In optics, simulators are used to simulate complex, costly, or hazardous phenomena. For example, simulation of imaging or simulation of processes in laser resonators.
Design of technical objects
Design is one of the main stages of product creation in engineering. Modern graphic systems allow you to visually visualize the designed object, which contributes to the early identification and solution of many problems. The developer judges his work not only by numbers and indirect parameters, he sees the design object on his own screen. Computer systems allow you to organize interactive interaction with the designed object and simulate the manufacture of a model from a plastic material. CAD systems greatly simplify and speed up the work of the design engineer, freeing him from the routine drafting process.
Organization of the user interface
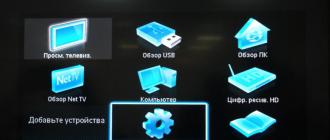
In the last 5-7 years, the visual paradigm for organizing the interface between the computer and the end user has become dominant. The windowed graphical interface is built into many modern operating systems. The set of controls that are used to build such an interface has already been fairly standardized. Most users are already accustomed to such an organization of the interface, which allows users to feel more comfortable and increase the efficiency of interaction.
All this suggests that in the operating system itself, a sufficiently large number of functions must already be implemented to render controls. For example, the Windows operating system provides developers with a GDI (Graphics Device Interface). As practice shows, for some applications, the capabilities provided by the system API are quite enough for visualizing the data being processed (building the simplest graphs, representing modeled objects and phenomena). But such drawbacks as low display speed, lack of support for 3D graphics do not contribute to its use for visualizing scientific data and computer modeling. Some scientific and technical programs with complex graphical output require functions for faster, more powerful and flexible visualization of calculated data, simulated phenomena, and designed objects.
Computer graphics technology
In modern scientific and technical applications, complex graphics rendering is implemented using the OpenGL library, which has become the de facto standard in the field of 3D rendering. The OpenGL library is a highly efficient software interface to graphics hardware. This library can achieve the highest performance in hardware systems running on the basis of modern graphics accelerators (hardware that frees up the processor and performs the calculations required for rendering).
The library's architecture and algorithms were developed in 1992 by specialists from Silicon Graphics, Inc. (SGI) for proprietary Iris graphics workstation hardware. A few years later, the library was ported to many hardware and software platforms (including Intel + Windows) and today it is a reliable multi-platform library.
The OpenGL library is free distribution, which is its undoubted advantage and the reason for such widespread use.
OpenGL is not an object-oriented, but a procedural library (about a hundred commands and functions), written in C. On the one hand, this is a drawback (computer graphics are a fertile area of \u200b\u200bobject-oriented programming), but programmers working with OpenGL can work with in C ++, Delphi, Fortran and even Java and Python.
In conjunction with OpenGL, several helper libraries are usually used to help customize the library in a given environment or perform more complex, complex rendering functions that are implemented through primitive OpenGL functions. In addition, there are a large number of specialized graphics libraries that use the OpenGL library as a low-level basis, a kind of assembler, on the basis of which complex graphics output functions are built (OpenInventor, vtk, IFL and many others). The OpenGL user community can be found at www.opengl.org
Microsoft has also developed and offers to use the DirectX multimedia library for similar purposes. This library is widely used in gaming and multimedia applications, but has not received widespread distribution in scientific and technical applications. The reason is, most likely, that DirectX only works under Windows.
Federal state budget
educational institution
higher professional education
East Siberian State Academy of Education
Faculty of Mathematics, Physics and Informatics
Department of Informatics and Informatics Teaching Methods
COURSE WORK
"Technology of visualization of educational information"
Specialty - "Professional training of computer technology, computing technology and informatics"
Irkutsk - 2012
AT conducting
I.Visualization technology theoretical foundations
II.The role of educational information visualization methods in teaching
III.Electronic visual teaching aids based on modern computer technologies
IV.Knowledge visualization technologies and presentation of research results in education
Conclusion
Bibliography
INTRODUCTION
The information richness of the modern world requires special preparation of educational material before presenting it to the learners, in order to provide students with basic or necessary information in a visually observable form. Visualization just presupposes the folding of information into an initial image (for example, into the image of an emblem, coat of arms, etc.).
One of the means of improving the professional training of future teachers who are capable of pedagogical innovations, to the development of technologies for designing effective educational activities of a student in the conditions of the dominance of the visual environment, is the formation of their special skills in visualizing educational information.
According to psychologists, new information is assimilated and remembered better when knowledge and skills are "imprinted" in the system of visual-spatial memory, therefore, the presentation of educational material in a structured form allows you to quickly and better assimilate new systems of concepts, methods of action.
Visualization of educational material opens up the opportunity not only to bring together all the theoretical calculations, which will allow you to quickly reproduce the material, but also to apply schemes to assess the degree of mastering of the topic under study.
The methodology of modern teaching using computer graphics and audiovisual means should be guided by future and modern technologies, including trends in the development of ways to use information and computer tools and technologies.
I. Theoretical foundations of visualization technology
In the era of information saturation, the problems of assembling knowledge and its operational use acquire colossal importance. In this regard, there is a need to systematize the accumulated experience of visualizing educational information and its scientific substantiation from the standpoint of a technological approach to learning.
G.K. Selevko considers the technology of intensification of teaching based on schematic and symbolic models of educational material as the experience of V.F. Shatalov. According to G.V. Lavrentyev. and Lavrentyeva N.E., its boundaries are much wider, and Shatalov's experience is just one of its manifestations. Expanding the boundaries of this technology, G.V. Lavrentieva. and Lavrentieva N.E. offer a more capacious name for it, namely: the technology of visualization of educational material, understanding by this not only symbolic, but also some other images of “visualization” that come to the fore depending on the specifics of the object under study. These can be the following basic elements of the visual image:
direction;
structure;
traffic.
Present to one degree or another in any visual image, these elements radically affect the perception and assimilation of educational information by a person. The intensification of educational and cognitive activity occurs due to the fact that both the teacher and the student are guided not only by the assimilation of knowledge, but also by the methods of this assimilation, by the ways of thinking, which make it possible to see the connections and relationships between the objects being studied, and therefore to link the separate into a single whole. The technology of visualization of educational information is a system that includes the following terms:
a set of educational knowledge;
visual methods of their presentation;
visual and technical means of information transmission;
a set of psychological techniques for using and developing visual thinking in the learning process.
The visualization technology of educational material has something in common with the pedagogical concept of visual literacy, which arose in the late 1960s in the United States. This concept is based on the provisions on the importance of visual perception for a person in the process of learning about the world and his place in it, the leading role of the image in the processes of perception and understanding, the need to prepare a person's consciousness for activity in an increasingly “visualized” world and an increase in information load.
The information richness of the modern world requires special preparation of educational material before presenting it to the learners, in order to provide students with basic or necessary information in a visually observable form. Visualization just presupposes the folding of information into an initial image (for example, into the image of an emblem, coat of arms, etc.). The possibilities of using auditory, olfactory, tactile visualization should also be taken into account, if these sensations are significant in this profession.
An effective way of processing and assembling information is its "compression", ie. presentation in a compact, easy-to-use form. The development of models for the representation of knowledge in a "compressed" form is engaged in a special branch of information technology - knowledge engineering. The didactic adaptation of the concept of knowledge engineering is based on the fact that, “firstly, the creators of intelligent systems rely on the mechanisms of processing and application of knowledge by humans, using the analogies of the neural systems of the human brain. Secondly, the user of intelligent systems is a person, which implies encoding and decoding of information by means that are convenient for the user, i.e. both in the construction and in the application of intelligent systems, the mechanisms of human learning are taken into account. " The theory of meaningful generalization by V.V. Davydov, the theory of enlargement of didactic units by P.M. Erdniev. Under the "compression" of information is understood, first of all, its generalization, consolidation, systematization, generalization. P.M. Erdniev asserts that "the greatest strength of mastering the program material is achieved when educational information is presented simultaneously in four codes: drawing, numerical, symbolic, and verbal." It should also be borne in mind that the ability to transform oral and written information into visual form is a professional quality of many professionals. Therefore, in the learning process, elements of professional thinking should be formed:
systematization;
concentration;
highlighting the main thing in the content.
The methodological foundation of the technology under consideration is formed by the following principles of its construction: the principle of system quantization and the principle of cognitive visualization.
Systemic quantization follows from the specifics of the functioning of human mental activity, which is expressed by various sign systems:
linguistic;
symbolic;
graphic.
All kinds of models of knowledge representation in a compressed compact form correspond to the human property to think in images. Studying, assimilating, pondering the text is precisely the drawing up of schemes in the mind, the coding of the material. If necessary, a person can restore, "expand" the entire text, but its quality and strength will depend on the quality and strength of these schemes in memory, on whether they were created intuitively by a student or professionally by a teacher. This is a rather difficult intellectual work and the student must be consistently prepared for it.
The greatest effect in the assimilation of information will be achieved if the methods of keeping records correspond to how the brain stores and reproduces information. Physiologists P.K. Anokhin, D.A. Pospelov argue that this does not happen linearly, in a list, similar to speech or writing, but in the interweaving of words with symbols, sounds, images, feelings. American scientists and educators B. Deporter and M. Henaki substantiate their system of quantum learning by the specifics of the work of the brain. Their contribution to the ways of creating models of educational material is "Memory cards", "Records of fixation and creation", "Method of grouping".
The principle of system quantization involves taking into account the following laws:
large amount of educational material is difficult to remember;
educational material located compactly in a certain system is better perceived;
highlighting semantic support points in the educational material contributes to effective memorization.
The principle of cognitive visualization follows from psychological laws, according to which the effectiveness of assimilation increases if the visualization in teaching performs not only an illustrative, but also a cognitive function, that is, cognitive graphic educational elements are used. This leads to the fact that the "figurative" right hemisphere is connected to the assimilation process. At the same time, "pillars" (pictures, diagrams, models), compactly illustrating the content, contribute to the consistency of knowledge. According to Z.I. Kalmykova, abstract educational material, first of all, requires concretization, and this goal corresponds to various types of visualization - from subject to very abstract, conventionally symbolic. “When perceiving visual material, a person can grasp with a single glance all the components that make up the whole, trace possible connections between them, categorize them according to the degree of significance, generality, which serves as the basis not only for a deeper understanding of the essence of new information, but also for its translation into long-term memory ".
A visual representation of the principles is shown in Figure 1.
OUSG - generalization, consolidation, systematization, generalization;
CO - signal supports;
MD - mental activity, realized through sign systems.
Figure: 1. Visual representation of the principles of cognitive visualization and system quantization
G.K. Selevko argues that any system or approach to learning can be considered a technology if it meets the following criteria:
availability of a conceptual framework;
consistency (integrity of parts);
manageability, that is, the ability to plan, design the learning process, vary the means and methods in order to obtain the planned result;
efficiency;
reproducibility.
The essence of the technology under consideration, according to G.V. Lavrentyev. and Lavrentieva N.E., is reduced to the integrity of its three parts.
Systematic use in the educational process of visual models of one specific type or their combinations.
Teaching students to rational methods of "compression" of information and its cognitive-graphic presentation.
Methodological techniques for including visual models in the educational process. Working with them has clear stages and is accompanied by a whole range of techniques and fundamental methodological solutions.
The role of educational information visualization methods in teaching
In recent decades, almost revolutionary changes have taken place in the field of visual information transmission:
the volume and quantity of transmitted information has tremendously increased;
new types of visual information and methods of its transmission have developed.
Technological progress and the formation of a new visual culture inevitably leaves its mark on the set of requirements for the activities of teachers.
One of the means of improving the professional training of future teachers who are capable of pedagogical innovations, to the development of technologies for designing effective educational activities of a student in the conditions of the dominance of the visual environment, is the formation of their special skills in visualizing educational information. The term "visualization" comes from the Latin visualis - perceived visually, visual. Information visualization presentation of numerical and textual information in the form of graphs, diagrams, structural diagrams, tables, maps, etc. However, such an understanding of visualization as an observation process presupposes minimal mental and cognitive activity of students, and visual didactic tools perform only an illustrative function. Another definition of visualization is given in the well-known pedagogical concepts (the theory of schemes - R.S. Anderson, F. Bartlett; the theory of frames - Ch. Volker, M. Minsky, etc.), in which this phenomenon is interpreted as the removal in the process of cognitive activity from the internal plan to the external plane of mental images, the form of which is spontaneously determined by the mechanism of associative projection.
Similarly, the concept of visualization is understood by AA Verbitsky: “The process of visualization is the folding of mental contents into a visual image; being perceived, the image can be deployed and serve as a support for adequate mental and practical actions. " This definition allows you to separate the concepts of "visual", "visual means" from the concepts of "visual", "visual means". In the pedagogical meaning of the concept "visual" is always based on the demonstration of specific objects, processes, phenomena, the presentation of a finished image given from the outside, and not born and taken out from the internal plan of human activity. The process of unfolding a mental image and "transferring" it from the internal plane to the external plane is a projection of the mental image. Projection is built into the processes of interaction between the subject and objects of the material world, it relies on the mechanisms of thinking, covers various levels of reflection and reflection, manifests itself in various forms of educational activity.
If we purposefully consider productive cognitive activity as a process of interaction between the external and internal plans, as the transfer of future products of activity from the internal plan to the external one, as an adjustment and implementation in the external plan of ideas, then visualization acts as the main mechanism that provides a dialogue between external and internal plans of activity. Therefore, depending on the properties of didactic visual aids, the level of activation of the mental and cognitive activity of students depends.
In this regard, the role of visual models for the presentation of educational information increases, allowing one to overcome the difficulties associated with learning based on abstract logical thinking. Depending on the type and content of educational information, methods of compaction or step-by-step deployment using a variety of visual means are used. At present, the use of cognitive visualization of didactic objects seems promising in education. This definition actually includes all possible types of visualization of pedagogical objects, functioning on the principles of concentration of knowledge, generalization of knowledge, expansion of orientation and presentation functions of visual didactic means, algorithmicization of educational and cognitive actions, implemented in visual means.
In practice, more than a hundred methods of visual structuring are used - from traditional diagrams and graphs to "strategic" maps (roadmaps), ray spiders (spiders) and causal chains (causal chains). This diversity is due to significant differences in the nature, characteristics and properties of knowledge in various subject areas. The greatest information capacity, in our opinion, is the universality and integrability of structural and logical schemes. This method of systematization and visual display of educational information is based on the identification of significant links between the elements of knowledge and analytical-synthetic activity when translating verbal information into non-verbal (figurative), synthesizing an integral system of knowledge elements. Mastering the listed types of concretizing meanings, unfolding a logical chain of thinking, describing images and their signs of mental activity, as well as operations using verbal means of exchanging information, forms productive ways of thinking that are so necessary for specialists at the current pace of development of science, technology and technology. According to the achievements of neuropsychology, "learning is effective when the potential of the human brain develops through overcoming intellectual difficulties in the search for meaning through the establishment of patterns."
Structural and logical diagrams create special visibility, arranging content elements in a non-linear form and highlighting logical and successive connections between them. Such visualization is based on the structure and associative connections characteristic of a person's long-term memory. In a way, structural-logical schemes act as an intermediate link between the external linear content (text of the textbook) and the internal nonlinear content (in the mind). As one of the advantages of the structural logic circuits A.V. Petrov emphasizes that "it performs the function of combining concepts into certain systems." By themselves, concepts cannot say anything about the content of the subject of instruction, but being linked by a certain system, they reveal the structure of the subject, its tasks and paths of development. Understanding and comprehending a new situation arises when the brain finds support in previous knowledge and ideas.
Hence the importance of constant updating of previous experience for mastering new knowledge. The process of learning new material can be represented as the perception and processing of new information by correlating it with the concepts and methods of action known to the student through the use of the intellectual operations mastered by him. The information entering the brain through various channels is conceptualized and structured, forming conceptual networks in consciousness. New information is built into existing cognitive schemas, transforms them and forms new cognitive schemas and intellectual operations. At the same time, connections are established between known concepts and methods of action and new knowledge, a structure of new knowledge emerges.
According to psychologists, new information is assimilated and remembered better when knowledge and skills are "imprinted" in the system of visual-spatial memory, therefore, the presentation of educational material in a structured form allows you to quickly and better assimilate new systems of concepts, methods of action. An example is the visual scheme: "RGB color model" (see Fig. 2).
Figure: 2. Scheme of the concept "RGB color model"
Visualization of educational material opens up the opportunity not only to bring together all the theoretical calculations, which will allow you to quickly reproduce the material, but also to apply schemes to assess the degree of mastering of the topic under study. In practice, the method of analyzing a specific diagram or table is also widely used, in which the skills of collecting and processing information are developed. The method allows students to be actively involved in the application of theoretical information in practical work. A special place is given to joint discussion, during which there is an opportunity to receive prompt feedback, to understand better oneself and other people. Summarizing what has been said, we note that, depending on the place and purpose of visual didactic materials, in the process of forming a concept (studying a theory, a phenomenon), various psychological and pedagogical requirements should be presented to the choice of a certain structural model and a visual display of the content of education.
When visualizing educational material, it should be borne in mind that visual images shorten the chains of verbal reasoning and can synthesize a schematic image of a larger "capacity", thereby condensing information. In the process of developing educational and methodological materials, it is necessary to control the degree of generalization of the training content, duplicate the verbal information of the figurative and vice versa, so that, if necessary, the links of the logical chain are fully restored by the students.
Another important aspect of using visual teaching materials is to determine the optimal ratio of visual images and verbal, symbolic information. Conceptual and visual thinking in practice are in constant interaction. They complement each other and reveal various aspects of the studied concept, process or phenomenon. Verbal-logical thinking gives us a more accurate and generalized reflection of reality, but this reflection is abstract. In turn, visual thinking helps to organize images, makes them holistic, generalized, complete.
Visualization of educational information allows you to solve a number of pedagogical problems:
provision of training intensification;
enhancing educational and cognitive activities;
formation and development of critical and visual thinking;
visual perception;
figurative presentation of knowledge and learning activities;
knowledge transfer and pattern recognition;
enhance visual literacy and visual culture.
Electronic visual teaching aids based on modern computer technologies
In school education, they have always used and still use a variety of types of visualization. Their role in the learning process is exceptional. Especially in the case when the use of visual aids is not limited to simple illustration in order to make the curriculum more accessible and easy to learn, but becomes an organic part of the student's cognitive activity, a means of forming and developing not only visual-figurative, but also abstract-logical thinking ... This, in turn, requires a significant revision and change of traditional visual teaching aids, which should become dynamic, interactive and multimedia.
In this regard, of particular interest is the computer visualization of educational information, which allows you to visually present objects and processes on the screen from all sorts of angles, in detail, with the ability to demonstrate the internal interconnections of components, including those hidden in the real world, and, which is especially important, in development, in temporal and spatial movement. Computer visualization of educational information is provided with specific visual teaching aids, created on the basis of modern multimedia technologies, thanks to which it becomes possible to include in the learning process all the variety of visual aids - text, graphics, sound, animation, video images. These are, for example, interactive maps, animated (dynamic) reference notes, interactive posters, etc. And in this case, we are not talking about a simple translation of traditional visual aids (tables, diagrams, pictures, illustrations) into digital format, but about the development and creation completely new types of visibility. Moreover, its appearance is caused not only by the need for expressive visual information and visual stimulation, to which modern students have already become accustomed, but also by the didactic features of this new type of educational visualization.
In the pedagogical literature, there is still no generally accepted concept for defining a new type of visualization, created on the basis of modern information technologies. This is due to the fact that this visibility is a very complex phenomenon, the special distinguishing features of which are integrated into a single integral system, and therefore it is so difficult to identify its essence, that is, to determine the main features and distinguish them from secondary properties. Even the authors use different names:
"Computer visualization";
"Dynamic visibility";
"Interactive visibility";
"Virtual visibility";
"Multimedia visibility";
"Hypertext visibility", etc.
At the same time, these terms are used in far from identical meanings, which creates additional difficulties.
In connection with this discord, Kuchurin V.V. proposes during the discussion to be guided by the concept of "electronic visibility", by which we mean a software computer tool for representing a complex of visual hypertext information of various types presented to the student on a computer screen, usually in an interactive (dialog) mode.
Electronic visualization components can be both static (pictures, diagrams, tables, etc.) and dynamic (video, animation) images.
Its main characteristics are interactivity, dynamism (animation) and multimedia.
First of all, electronic visual teaching aids are interactive. This is a fairly broad concept, with the help of which the nature and degree of interaction between objects is revealed in modern science. Moreover, this property is not at all reduced to communication between people. In training with the use of information and communication technologies, interactivity is "the ability of the user to actively interact with the information carrier, to select it at his own discretion, to change the rate at which the material is presented." In accordance with this, the interactivity of visual teaching aids based on multimedia provides the student and teacher, within certain limits, with the opportunity to actively interact with it and control the presentation of information, namely, to ask a question and receive an answer to it (feedback interactivity) to determine the beginning, duration and speed of the demonstration process (temporary interactivity), determine the sequence of using fragments of information (ordinal interactivity,) change, supplement or reduce the amount of content information (content interactivity) and even create your own creative product (creative interactivity). Such capabilities of interactive visual teaching aids allow the use of problem-based teaching methods that ensure the assimilation of scientific concepts and patterns based on personal experience of interaction with them. In other words, interactivity provides opportunities not only for passive perception of information, but also for active research of the characteristics of the studied objects or processes. Consequently, interactivity gives electronic visualization a cognitive (cognitive) character, introduces game and research components into educational work, naturally encourages students to deep and comprehensive analysis of the properties of the studied objects and processes.
The dynamic nature of electronic visual teaching aids is provided using animation technology, which allows you to manipulate the color, size of objects, create local animation, highlight one of the objects or part of an object by underlining, stroking, filling, etc. In addition, using animation, the illusion of movement is created. change, development. All this makes the visibility more emotional and impressive. At the same time, animation, giving a visual representation of the dynamics of a phenomenon, creates conditions for demonstrating the signs and patterns of the events, phenomena and processes under study through action, for comparing different opinions and formulating one's own point of view. Thus, the dynamics of computer animation is used not only and even not so much to enhance the emotional impact through showing the movement of an object ("live picture"), but to activate cognitive activity, to visually demonstrate the logic of the movement of thought from ignorance to knowledge.
Of particular importance for the characteristics of electronic visualization, created on the basis of modern information technologies, is also such a property as multimedia. It is associated with modern information technologies based on the simultaneous use of various means of presenting information and representing a set of techniques, methods, methods and means of collecting, accumulating, processing, storing, transmitting, producing audiovisual, textual, graphic information in the context of interactive user interaction with the information system that implements the capabilities of multimedia operating environments. Multimedia technologies allow integrated presentation of any audiovisual information on the screen, realizing an interactive dialogue between the user and the system. Due to this, they are actively used in the development and creation of visual teaching aids, the components of which are static and animated images, as well as text and video information with sound.
According to the main characteristics, electronic visual aids can be divided into dynamic (animated), interactive, and multimedia.
Dynamic (animated) visualization is a teaching tool that is a moving, changing image. It allows you to form visual representations of the development of events and processes in time and space, to concentrate the attention of students on a specific object of study, to increase the density of the lesson by accelerating the supply of information. The control is limited to the functions of play, stop and pause, which, by the way, indicates the limited, in this case temporary, interactivity of dynamic (animated) visibility.
Dynamic (animated) visualization includes such specific visual teaching aids as animated maps, animated diagrams, diagrams, graphs, slideshows.
Interactive Visualization is a learning tool that is a hypertext animated illustration combined with a set of management tools that allow the user to interact with it interactively.
Currently, teachers use interactive maps, interactive diagrams, interactive site plans, interactive reconstructions, etc.
Multimedia visualization is a teaching tool in which information objects of various types are integrated: sound, text, image.
An example of multimedia visualization is multimedia, multimedia panoramas, electronic sound poster.
Unfortunately, at present, the use of visual teaching aids created on the basis of modern information technologies causes noticeable difficulties for many teachers associated with the selection of visual aids for solving specific pedagogical problems, techniques and methods of working with them and forms of organizing educational activities.
IV. Technologies for visualization of knowledge and presentation of research results in the field of education
visualization educational learning computer
The development of computer technology has solved the problems of processing such a volume of information. But there was a problem to visualize the results of such processing. Various visualization techniques are used here, through which large and complex amounts of data can be easily represented. Visual image recognition systems - 2-dimensional (symbols, graphical signs, codes, barcodes) - FineReader and 3-dimensional objects (photographic images, security and video systems) - built-in in modern photographic equipment, machine vision technology (work of computer systems with data arrays).
Graphs and charts make the text easier to read and easier to read by humans. Sometimes a few diagrams are enough to understand the meaning of what is presented on several pages of the project.
Color coding is used in research to analyze and predict various physical and mathematical processes. For example, in the study of heat processes, energy transmission, one can clearly demonstrate the distribution and trend of temperature in a color scheme, in sociological processes, and illustrate natural phenomena.
The rapid development of 3-D graphics - scientific visualization has formed into an independent branch of science, incorporating the basics of differential calculus, geometry, programming. The shift to 3D technology has transformed graphics from a presentation medium into a powerful method for solving scientific problems. Three-dimensional visualization can be widely used for educational systems in various fields of science. Teaching using three-dimensional models is very visual and allows you to diversify the forms of presentation of the material and increase the interest of the listener.
Virtual visualization is of the greatest importance in interactive training systems, such as simulators of various types.
Professionals who use audio and visual technologies in their professional activities need permanent professional development. Since they usually already have basic education, tracking the development of new technologies, methods of using new software products and solutions can be implemented through remote forms. This refers to case technologies, various forms of remote testing and certification, web conferences, and the like.
The Internet plus project activities using ICT tools is today a powerful tool, both in the educational and in the social sphere, to promote new teaching methodologies, business development and increase the competence of a specialist, but it must be used skillfully. In the conditions of modern information and social realities, there is a need for a new methodological approach to teaching such disciplines related to the use of computer graphics, audiovisual means.
The development trends of modern information technologies lead to a constant increase in the complexity of information systems (IS), and, accordingly, the content of the disciplines of their study for various specializations. Modern disciplines in the field of ICT are characterized by the following features: complexity of description (a large number of functions, processes, data elements and complex relationships between them), which requires the study of laws and techniques for modeling and analyzing data and processes, as well as new intelligent tools.
The methodology of modern teaching using computer graphics and audiovisual means should be guided by future and modern technologies, including trends in the development of ways to use information and computer tools and technologies. In the modern methodology, of course, the necessary technical conditions, software and requirements for the user must be presented, which create the conditions for referring to digital graphics and computer design. But it is even more important that the composition of educational and methodological complexes should initially include the possibility of their modernization and integration with a dynamic change in the information resource.
Conclusion
In this course work, the technologies of visualization of educational information were considered, which make it possible to variably and rationally use various schematic-sign models of knowledge representation; eliminate the imbalance of the text and illustrative visuals, "clogging" with text; to increase the expressiveness of the visual language and symbols, which are gaining special significance in the age of information technology; optimize the time spent on the perception and assimilation of information and thereby increase the efficiency of educational and cognitive activities.
Bibliography
Russian Pedagogical Encyclopedia: In 2 volumes / Ch. ed. V.V. Davydov .- M .: Great Russian Encyclopedia, 1993.- Vol. 2.- 608 p.
Choshanov M.A. Flexible technology of problem-modular learning: Method. manual.- M .: Public education, 1996.- 160 p.
Erdniev P.M. Systematic knowledge and strengthening of the didactic unit // Sov. Pedagogy.-1975.-№4.-P. 72-80.
Kalmykova Z.I. Does the educational system of V.F. Shatalova? // Questions of psychology. - 1987.-№2. P. 71-80.
Selevko G.K. Modern educational technologies: Textbook. manual.- M .: Public education, 1998.- 256 p.
Manko, N.N. Cognitive visualization of didactic objects in enhancing educational activity // News of the Altai State University. Series: Pedagogy and Psychology. - No. 2. - 2009. - S. 22-28.
Verbitsky, A.A.Active learning in higher education: contextual approach / A.A. Verbitsky. - M .: Higher. shk., 1991 .-- 207 p.
Blake, S., Peyp, S., Choshanov, M.A.Using the achievements of neuropsychology in the pedagogy of the USA // Pedagogy. - No. 5. - 2004. - S. 85-90.
Petrov, A.V. Developmental training. The main questions of the theory and practice of higher education in physics: monograph / A.V. Petrov. - Chelyabinsk: Fakel Publishing House, 1997.
Lozinskaya A.M.Frame method of structuring the content of a modular program for teaching physics / A.M. Lozinskaya // Bulletin of the Ural State University. - 2009. - No. 3 (67). - S. 176-184.
The saying “it's better to see once than hear a hundred times” reflects the essence of such a process as visualization.
Visualization (from lat. visualis, "Visual") - the general name of the techniques for presenting numerical information or a physical phenomenon in a form convenient for visual observation and analysis (wikipedia).
What is visualization? The concept itself is quite multifaceted, there are several definitions, depending on what field of activity we are talking about. The purpose of visualization is to transfer data. Information visualization is the process of representing abstract data in the form of images that can help you understand the meaning of the data. (FB.ru)
Not only children, but also many people perceive information poorly by ear, some of it is not recognized and is lost, some is perceived incorrectly, a dry monologue quickly tires, can cause demotivation of students. Visualization of the submitted material provides clarity, clear perception and understanding, the ability to repeatedly refer to the information presented, the ability to compare with previous and subsequent information.
The following visualization methods are distinguished:
1 Figure
Drawing, apparently, was the world's first conscious attempt to visualize images in order to demonstrate them to another person.
2 Graph
Graphs are primarily intended to illustrate mathematical concepts, functional dependencies, or relationships between objects.
3 Chart
Diagrams allow you to illustrate quantitative relationships in a specific area.
4 Photography
5 Map(wikipedia).
The inclusion of visualization in the educational process allows you to actively use a powerful visual channel for obtaining information. In addition to a more understandable and visual form of obtaining information, there is an additional activation of the nervous system, providing increased attention and concentration of students on the subject of study.
There is another important rendering effect. By formalizing the results of independent discussion of a new topic, students connect the most powerful potential of creativity to learning. The search for original forms of reflecting the results of the team's work, the realization of all one's abilities in this process, free self-expression and the associated bright positive emotions ensure the effective assimilation and reliable consolidation of new knowledge and skills!
For visualization in the educational process, you can use the usual colored crayons, colorful cards, stickers, clippings from magazines, watercolors, modeling materials and other items suitable for this purpose. Theatricalization of the presentation of the results of the discussion will also provide a vivid visual effect and a strong memorization of the material. In fact, the options for presenting the process and learning outcomes are endless, more precisely, they are determined by the tasks of each section of the lesson and are limited exclusively by the imagination of the teacher, students and resource opportunities.
Active methods of presenting information, various techniques and methods of visualizing material revitalize the educational process, are positively perceived by students and have a positive effect on learning outcomes. Take the time to plan and implement this process in the lesson!
Download:
Preview:
Visualization
The saying “it's better to see once than hear a hundred times” reflects the essence of such a process as visualization.
Visualization (from lat. visualis , "Visual") - the general name of the techniques for presenting numerical information or a physical phenomenon in a form convenient forvisual observation and analysis (wikipedia).
What is visualization? The concept itself is quite multifaceted, there are several definitions, depending on what field of activity we are talking about. The purpose of visualization is to transfer data. Information visualization is the process of representing abstract data in the form of images that can help you understand the meaning of the data. (FB.ru)
Not only children, but also many people perceive information poorly by ear, some of it is not recognized and is lost, some is perceived incorrectly, a dry monologue quickly tires, can cause demotivation of students. Visualization of the submitted material provides clarity, clear perception and understanding, the ability to repeatedly refer to the information presented, the ability to compare with previous and subsequent information.
The following visualization methods are distinguished:
1 Figure
Drawing, apparently, was the world's first conscious attempt to visualize images for their demonstration by a friendfrom a person.
2 Graph
Graphs are primarily intended for illustrationmathematical concepts, functional dependencies or relationships between objects.
3 Chart
Diagrams allow you to illustrate ifquantitative relations in a certain area.
4 Photography
5 Map (wikipedia).
The inclusion of visualization in the educational process allows you to actively use a powerful visual channel for obtaining information. In addition to a more understandable and visual form of obtaining information, there is an additional activation of the nervous system, providing increased attention and concentration of students on the subject of study.
There is another important rendering effect. By formalizing the results of independent discussion of a new topic, students connect the most powerful potential of creativity to learning. The search for original forms of reflecting the results of the team's work, the realization in this process of all one's abilities, free self-expression and the associated bright positive emotions ensure the effective assimilation and reliable consolidation of new knowledge and skills!
For visualization in the educational process, you can use the usual colored crayons, colorful cards, stickers, clippings from magazines, watercolors, modeling materials and other items suitable for this purpose. Theatricalization of the presentation of the results of the discussion will also provide a vivid visual effect and a strong memorization of the material. In fact, the options for presenting the process and learning outcomes are limitless, more precisely, they are determined by the tasks of each section of the lesson and are limited exclusively by the imagination of the teacher, students and resource opportunities.
Active methods of presenting information, various techniques and methods of visualizing material revitalize the educational process, are positively perceived by students and have a positive effect on learning outcomes. Take the time to plan and implement this process in the lesson!
By tradition, let's start with a definition.
Information visualization - presentation of information in the form of graphs, diagrams, structural diagrams, tables, maps, etc.
ecsocman.edu.ru
Why visualize information? "Stupid question!" - the reader will exclaim. Of course, text with pictures is perceived better than "gray" text, and pictures with text are perceived even better. It is not for nothing that we all love comics so much - after all, they allow us to literally grasp information on the fly, seemingly without applying the slightest mental effort! And remember how well you remember during your studies the material of those lectures, which were accompanied by slides!
The first thing that comes to our minds when we say visualization is graphs and diagrams (here it is, the power of associations!). On the other hand, only numerical data can be visualized in this way; no one has yet managed to build a graph based on connected text. For the text, we can build a plan, highlight the main thoughts (theses) - make a short summary. We'll talk about the disadvantages and dangers of note-taking a little later, but now we will say that if you combine the plan and a short summary - "hang" the theses on the branches of a tree, the structure of which corresponds to the structure (plan) of the text, then we will get an excellent block diagram text that will be remembered much better than any synopsis. In this case, the branches will play the role of those "tracks" - tracks connecting concepts and theses that we talked about earlier.
Remember how we built UML diagrams based on the description of the designed software system received from its future users? The resulting images were perceived by both clients and developers much easier and faster than a text description. In the same way, you can "portray" absolutely any text, not only the technical task for the development of the system. The approach we have described above allows you to visually present absolutely any text - be it a fairy tale, a technical task, a lecture, a fantasy novel or the results of a meeting - in the form of a convenient and easy-to-understand tree. You can build it as you like - if only you get a clear and understandable diagram, which would be nice to illustrate with appropriate drawings.
Such schemes are also convenient to use in communication when discussing any issues and problems. As practice shows, the absence of clear notation standards creates absolutely no communication difficulties for the participants in the discussions. On the contrary, the use of non-verbal forms of presentation of information allows you to focus on precisely the key points of the problem. Thus, visualization is one of the most promising areas of increasing the efficiency of analysis, presentation, perception and understanding of information.
Wow, at last we are done with the boring description of scientific theories, methods and techniques used to process, organize and visualize information! The previous part of the chapter greatly tired both the author and the readers, and nevertheless, it was necessary: \u200b\u200bas a result, we saw that the features of our brain are already actively used by scientists in various fields of science, many things that seem familiar to us are personal computers, user interfaces, knowledge bases, etc. - were originally built taking into account the associative nature of human thinking and its tendency to hierarchical representation and visualization of information. But the pinnacle and natural graphic expression of human thought processes is mind mapping, which we are finally discussing. And at the same time we will try to expand our understanding of the principles of visual thinking.
In recent decades, almost revolutionary changes have taken place in the field of visual information transmission:
the volume and quantity of transmitted information has tremendously increased;
new types of visual information and methods of its transmission have developed.
Technological progress and the formation of a new visual culture inevitably leaves its mark on the set of requirements for the activities of teachers.
One of the means of improving the professional training of future teachers who are capable of pedagogical innovations, to the development of technologies for designing effective educational activities of a student in the conditions of the dominance of the visual environment, is the formation of their special skills in visualizing educational information. The term "visualization" comes from the Latin visualis - perceived visually, visual. Information visualization presentation of numerical and textual information in the form of graphs, diagrams, structural diagrams, tables, maps, etc. However, such an understanding of visualization as an observation process presupposes minimal mental and cognitive activity of students, and visual didactic tools perform only an illustrative function. Another definition of visualization is given in the well-known pedagogical concepts (the theory of schemes - R.S. Anderson, F. Bartlett; the theory of frames - Ch. Volker, M. Minsky, etc.), in which this phenomenon is interpreted as the removal in the process of cognitive activity from the internal plan to the external plane of mental images, the form of which is spontaneously determined by the mechanism of associative projection.
Similarly, the concept of visualization is understood by AA Verbitsky: “The process of visualization is the folding of mental contents into a visual image; being perceived, the image can be deployed and serve as a support for adequate mental and practical actions. " This definition allows you to separate the concepts of "visual", "visual means" from the concepts of "visual", "visual means". In the pedagogical meaning of the concept "visual" is always based on the demonstration of specific objects, processes, phenomena, the presentation of a finished image given from the outside, and not born and taken out from the internal plan of human activity. The process of unfolding a mental image and "transferring" it from the internal plane to the external plane is a projection of the mental image. Projection is built into the processes of interaction between the subject and objects of the material world, it relies on the mechanisms of thinking, covers various levels of reflection and reflection, manifests itself in various forms of educational activity.
If we purposefully consider productive cognitive activity as a process of interaction between the external and internal plans, as the transfer of future products of activity from the internal plan to the external one, as an adjustment and implementation in the external plan of ideas, then visualization acts as the main mechanism that provides a dialogue between external and internal plans of activity. Therefore, depending on the properties of didactic visual aids, the level of activation of the mental and cognitive activity of students depends.
In this regard, the role of visual models for the presentation of educational information increases, allowing one to overcome the difficulties associated with learning based on abstract logical thinking. Depending on the type and content of educational information, methods of compaction or step-by-step deployment using a variety of visual means are used. At present, the use of cognitive visualization of didactic objects seems promising in education. This definition actually includes all possible types of visualization of pedagogical objects, functioning on the principles of concentration of knowledge, generalization of knowledge, expansion of orientation and presentation functions of visual didactic means, algorithmicization of educational and cognitive actions, implemented in visual means.
In practice, more than a hundred methods of visual structuring are used - from traditional diagrams and graphs to "strategic" maps (roadmaps), ray spiders (spiders) and causal chains (causal chains). This diversity is due to significant differences in the nature, characteristics and properties of knowledge in various subject areas. The greatest information capacity, in our opinion, is the universality and integrability of structural and logical schemes. This method of systematization and visual display of educational information is based on the identification of significant links between the elements of knowledge and analytical-synthetic activity when translating verbal information into non-verbal (figurative), synthesizing an integral system of knowledge elements. Mastering the listed types of concretizing meanings, unfolding a logical chain of thinking, describing images and their signs of mental activity, as well as operations using verbal means of exchanging information, forms productive ways of thinking that are so necessary for specialists at the current pace of development of science, technology and technology. According to the achievements of neuropsychology, "learning is effective when the potential of the human brain develops through overcoming intellectual difficulties in the search for meaning through the establishment of patterns."
Structural and logical diagrams create special visibility, arranging content elements in a non-linear form and highlighting logical and successive connections between them. Such visualization is based on the structure and associative connections characteristic of a person's long-term memory. In a way, structural-logical schemes act as an intermediate link between the external linear content (text of the textbook) and the internal nonlinear content (in the mind). As one of the advantages of the structural logic circuits A.V. Petrov emphasizes that "it performs the function of combining concepts into certain systems." By themselves, concepts cannot say anything about the content of the subject of instruction, but being linked by a certain system, they reveal the structure of the subject, its tasks and paths of development. Understanding and comprehending a new situation arises when the brain finds support in previous knowledge and ideas.
Hence the importance of constant updating of previous experience for mastering new knowledge. The process of learning new material can be represented as the perception and processing of new information by correlating it with the concepts and methods of action known to the student through the use of the intellectual operations mastered by him. The information entering the brain through various channels is conceptualized and structured, forming conceptual networks in consciousness. New information is built into existing cognitive schemas, transforms them and forms new cognitive schemas and intellectual operations. At the same time, connections are established between known concepts and methods of action and new knowledge, a structure of new knowledge emerges.
According to psychologists, new information is assimilated and remembered better when knowledge and skills are "imprinted" in the system of visual-spatial memory, therefore, the presentation of educational material in a structured form allows you to quickly and better assimilate new systems of concepts, methods of action. An example is the visual scheme: "RGB color model" (see Fig. 2).

Figure: 2.
Visualization of educational material opens up the opportunity not only to bring together all the theoretical calculations, which will allow you to quickly reproduce the material, but also to apply schemes to assess the degree of mastering of the topic under study. In practice, the method of analyzing a specific diagram or table is also widely used, in which the skills of collecting and processing information are developed. The method allows students to be actively involved in the application of theoretical information in practical work. A special place is given to joint discussion, during which there is an opportunity to receive prompt feedback, to understand better oneself and other people. Summarizing what has been said, we note that, depending on the place and purpose of visual didactic materials, in the process of forming a concept (studying a theory, a phenomenon), various psychological and pedagogical requirements should be presented to the choice of a certain structural model and a visual display of the content of education.
When visualizing educational material, it should be borne in mind that visual images shorten the chains of verbal reasoning and can synthesize a schematic image of a larger "capacity", thereby condensing information. In the process of developing educational and methodological materials, it is necessary to control the degree of generalization of the training content, duplicate the verbal information of the figurative and vice versa, so that, if necessary, the links of the logical chain are fully restored by the students.
Another important aspect of using visual teaching materials is to determine the optimal ratio of visual images and verbal, symbolic information. Conceptual and visual thinking in practice are in constant interaction. They complement each other and reveal various aspects of the studied concept, process or phenomenon. Verbal-logical thinking gives us a more accurate and generalized reflection of reality, but this reflection is abstract. In turn, visual thinking helps to organize images, makes them holistic, generalized, complete.
Visualization of educational information allows you to solve a number of pedagogical problems:
provision of training intensification;
enhancing educational and cognitive activities;
formation and development of critical and visual thinking;
visual perception;
figurative presentation of knowledge and learning activities;
knowledge transfer and pattern recognition;
enhance visual literacy and visual culture.