The use of GIS in the management of the territory and economy
“The scope of GIS is limited only by your imagination”
1. Introduction
At present, it is difficult to imagine a field of human activity in which a computer would not be used. Computers are used almost everywhere: in art, science, education, medicine, industry, trade and in many other areas. Almost total automation affected some areas, in others this process is just beginning.
One of the areas of activity where the automation process is only beginning to gain momentum is the management of territories and the economy. To manage the territory, as a rule, GIS are used - geographic information systems or geographic information systems.
In industrialized countries, where automation has been focused on for a long time, the automation of territorial administration is more or less established. As for Russia, then this process started off only in certain regions of the country. And then all the features of a GIS, as a rule, come down to showing a map or a plan of a certain territory.
2. Geographic information system, concept and software
2.1 The concept of GIS
A geographic information system (GIS) is a hardware-software complex that solves the tasks of storing, displaying, updating, and analyzing spatial and attribute information on territory objects. One of the main functions of GIS is the creation and use of digital (electronic) maps, atlases and other cartographic works. The basis of any information system is data. GIS data is divided into spatial, semantic, and metadata.
Spatial data - data describing the location of an object in space. For example, the coordinates of the corner points of a building, presented in local or any other coordinate system. Semantic (attribute) data - data about the properties of an object. For example, address, cadastral number, number of storeys and other characteristics of the building.
Metadata - data about the data. For example, information about who, when, and using what source material, information about the object was entered into the system.
Initially, GIS was created to study natural resources in the mid-1960s, and now in industrialized countries there are thousands of GIS used in economics, politics, ecology, management and protection of natural resources, cadastre, science, education, etc. They integrate cartographic information, remote sensing and environmental monitoring data, statistics and censuses, hydrometeorological observations, expeditionary materials, drilling results, etc.
Structurally, the GIS for managing the territory is a centralized database of spatial objects and a tool that provides the ability to store, analyze and process any information related to a particular GIS object, which greatly simplifies the process of using information about the objects of the territory by interested services and persons.
It is also worth noting that the GIS can be (and should) be integrated with any other information system that uses data about the objects of the territory. For example, the automation system of the property management committee should use an address plan and a map of GIS land plots in its work. Also in the GIS can be stored areas containing the coefficients of rental rates that can be used in calculating rents.
In the case when a centralized GIS is used, all employees of the local government have the opportunity to receive regulated access to relevant GIS data, while spending much less time on their search, analysis and synthesis.
GIS are designed to solve scientific and applied problems of inventory, analysis, assessment, forecasting and management of the environment and territorial organization of a society.
The basis of GIS is automated cartographic systems, and the main sources of information are various geoimages.
2.2 GIS software
The software can be basic and applied. Basic software is the foundation for any problem-oriented GIS. The basic software provides all the basic functions needed by the developer of a problem-oriented GIS. This software is developed by a fairly large number of commercial and non-profit organizations. Application software is developed for a specific application and provides solutions to certain narrow tasks.
Basic GIS software is currently widely marketed. There are foreign and domestic developments. All software on the market differs in functionality and price. Moreover, functionality and price are directly proportional. Although relatively simple tasks can be solved using free Open Source GIS technologies.
The most functional and, accordingly, the most widely used products are ESRI products. ESRI has developed GIS software for a wide range of applications. The product line is represented by server and desktop applications with functionality of different levels. MapInfo and Itergraph are also widely known.
3. The use of GIS in the management of the territory and economy
Interest in the implementation of GIS in the practice of state and municipal government around the world remains high for many years. In Russia and the CIS countries, quite a lot of attention is also paid to GIS projects. And if earlier in the implementation of such projects, government bodies (ministries, agencies, etc.) showed great activity, recently local authorities: regional and municipal governments have shown serious interest. This is due to significant changes in the legislation, significantly changing the economic basis of regional management. Municipalities are given great opportunities and, at the same time, they are responsible for managing land and real estate, maintaining infrastructure, maintaining the ecological environment and ensuring public safety.
Geoinformation systems have long been widely used to solve problems of state and municipal government. There are many examples of successful and not very successful implementation of GIS in the practice of the relevant bodies. Of course, the efficiency of using GIS is determined by many factors, and, probably, not only by the choice of software from one or another provider. However, the very ability to implement the required functions, build a complete information system, integrate it into the existing information infrastructure, implement and provide technical support for solutions, significantly depends on the properties and quality of GIS software.
GIS technology provides a means to display and understand what is in one particular or many locations, provides tools for modeling resources, identifying relationships, processes, dependencies, examples, threats and risks. These capabilities allow you to see what is really happening and where, measure the size and scale of the event or impact, jointly analyze a variety of data, develop plans and, ultimately, help you decide what steps and actions should be taken. The ability of GIS to integrate spatial and non-spatial data, together with the functions of analysis and modeling of processes, allows this technology to be used as a common platform for integrating business processes of different departments, activities and disciplines throughout the city or regional government.
For effective management of municipalities and dynamically developing regions, reliable and relevant data on objects and processes on their territory, as well as advanced technologies for the accumulation, processing and presentation of information are required. Modern geographic information systems with their developed analytical capabilities allow you to visually display and comprehend information about specific objects, processes and phenomena in their entirety. GIS allows you to identify relationships and spatial relationships, support the collective use of data and their integration into a single information array.
Digital maps, or a digital cartographic basis with thematic layers, which are the geospatial basis of GIS, can connect databases of real estate, land plots of organizations, monetary valuation of land, engineering structures, monuments of urban planning and architecture, information on geology, development history, etc. The database can also organize the storage of both graphical and all technical, reference and other documentation.
In modern GIS, the possibility of three-dimensional representation of the territory has appeared. Three-dimensional models of objects, embedded in a three-dimensional landscape, designed on the basis of digital cartographic data and remote sensing materials, can improve the quality of visual analysis of the territory and provide informed decisions with greater efficiency.
4 GIS Usage Examples
The following are examples of possible GIS applications. Only a small part of the possible solutions is described.
4.1 Using GIS in communications management
When using various communication networks, a problem inevitably arises related to the identification of emergency situations and the forecast of its development.
Currently, with the help of GIS technologies, the following tasks are being successfully solved:
- determining the location of damage to the main cable or pipe according to consumer complaints;
- forecast of the further development of the emergency;
- solving the issue of the speedy elimination of emergency situations;
- solving issues on the organization of backup electricity, water or heat supply to important infrastructure facilities;
- monitoring the status of communication network facilities and organizing timely repair or reconstruction
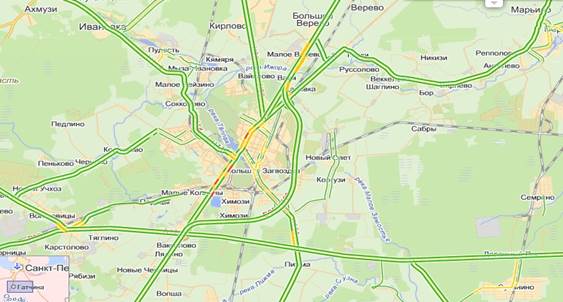
4.2 Use of GIS in traffic management
Currently, cartographic services for tracking traffic congestion are widely known. For example, Yandex Traffic.
However, with the help of GIS-Technologies, it is also possible to directly control the organization of traffic. The system is able to automatically change traffic conditions on the basis of traffic congestion data using technical means in a specific area. For example, change the phases of switching traffic lights, change the number of lanes for traffic or organize a detour.
 |
4.3 Use of GIS in forest management issues
GIS has found widespread use in forest management.
The following tasks are successfully solved:
- accounting for the species composition of forest stands;
- distribution of plots for various types of legal cutting;
- organization of forest restoration;
- tracking the health of the forest;
- damage assessment from forest fires.
4.4 Public GIS
Currently, various authorities seek to ensure transparency of their activities for the population. For this, the global Internet is widely used. Currently, resources have begun to appear that allow everyone to get acquainted with a variety of information about the territory.
Of course, such GIS does not publish data whose distribution is limited by current legislation.
4.5 Environmental monitoring
GIS technologies are widely used to make decisions on the organization of environmental protection measures, as well as to evaluate the effectiveness of these measures.
 |
GIS allows you to simultaneously work with large volumes of data, which makes it possible to assess the degree of environmental impact of an existing or planned hazardous facility.
4.6 Town planning GIS
The very process of creation and the very structural construction of urban planning project documentation, obviously, testifies to the effectiveness of the use of GIS technologies.
Firstly, since the initial data of many organizations, including graphic documents, are usually presented on different cartographic bases and often in the form of diagrams, it is GIS technologies that allow them to be brought to a “common denominator”, ie to a single cartographic basis.
Secondly, sections and cartographic materials are created in digital form in separate directions, representing, in essence, thematic cartographic and semantic bases of the geographic information system.
Thirdly, a coupled analysis of the above information is carried out and a synthetic scheme is created, "Comprehensive Urban Analysis of the Territory," where the entire powerful arsenal of GIS technologies can be successfully applied.
Fourth, based on the analysis, project proposals for urban development of the territory (Project Plan) and sectoral engineering design schemes are developed that detail and reinforce the project proposals of the General Plan, where the use of GIS technologies is also very effective.
4.7 Use of GIS in emergency situations
GIS allows you to solve problems by assessing the causes and forecasts of various emergencies:
- a forecast of the consequences of the leakage of toxic substances at a hazardous facility for deciding on the evacuation of the population and assessing environmental damage;
- forecast for the development of a forest fire based on weather conditions;
- forecast of flooded areas during the breakthrough of dams and floods;
- assessment of economic damage.
 |
4.8 GIS and demography
GIS technologies are widely used to assess the composition of the population and to make decisions on the arrangement of various objects of social infrastructure. For example, load planning for secondary schools, kindergartens and medical facilities.
GIS technologies today are used almost everywhere - in forestry, construction, cartography, ecology, seismology and so on. They are studied at universities and research institutes. GIS technology is an entire industry that affects almost all aspects of human life. But at the same time, it is very difficult to give a clear definition to this type of technology. After all, this is not just a set of systematized knowledge. This is a special view of the world. Our GIS technology will tell you how GIS technologies work and what they are intended for.
What is a GIS?
GIS is a geographic information system. It allows you to map the objects of the surrounding world, and then analyze them by a huge number of parameters, visualize them and based on these data to predict a variety of events and phenomena. Such a powerful technology allows us to solve a huge number of tasks using GIS, both global and private. GIS technology can stand in the service of all mankind, preventing environmental disasters or helping to solve the problems of overpopulation of individual regions.
GIS can also be used for the needs of individual companies, to establish an effective business with its help. For example, a transportation company using special databases can select the best routes for their vehicles, utilities - to lay communications to new homes and so on.
How does GIS work?
The information system is a huge database of digital data converted to digital format. They are detailed layers, united by geographical feature and tied to a specific coordinate system. Any events occurring can be successfully tracked on such a database. In addition, with its help you can find almost anywhere in the world, track the movement of almost any object.
GIS databases are capable of performing five different tasks. You can enter relevant data into the database, and in most cases this happens automatically using a scanner. You can manipulate the data, scale it as you wish, collect the information necessary to solve a specific problem. Like regular databases, a GIS system can be managed. This is done through a range of integrated applications.
A large amount of data contained in the database gives ample opportunities for analysis on a variety of parameters. You can find free sites for building a house, optimally form traffic flows, analyze the proximity of various objects (for example, determine the number of people living within walking distance from your store), superimpose various indicators on each other and analyze the resulting picture.
The last task that GIS allows you to do is visualize data. You can get maps, charts, tables and even photos of the area you are interested in. These data are of great importance both for scientific research and for the work of individual companies and organizations.
Where are GIS technologies applied?
From the descriptions proposed above, it becomes clear that GIS technologies are widely used in various fields of activity. But what exactly can they do? Here are a few examples that show what the real benefits of GIS technology are.
· By identifying the relationship between various indicators, you can develop more efficient work technologies and save quite a lot of money. Analyze how the type of soil, climate and productivity of certain crops are related, and you will understand where it is best to cultivate them.
· Having set certain search criteria, you can easily find the object you need, and, without spending too much time, engage in its development. Finding an apartment that will have a certain number of rooms, the size of the kitchen and at the same time will be located close to your children’s work and school is now very simple.
· GIS can have a positive impact on business processes taking place within organizations. A huge database can be useful in any field, because it provides opportunities for clear work planning. Utilities can not only quickly monitor equipment wear and plan maintenance work, but also notify those residents who are affected by this.
· Today, maps of cities and localities are quickly becoming obsolete - new construction is underway, roads are being designed. GIS allows you to track these changes and make them to the database almost instantly. Launched into a virtual network, such a card will always have the latest data at hand.
GIS technology is not just a computer database. These are great opportunities for analyzing, planning and regularly updating information. GIS technologies today are used in almost all areas of life, and this helps to really effectively solve many problems.
An unambiguous brief definition of this phenomenon is difficult to give. Geographic Information System (GIS) is an opportunity for a new look at the world around us. If we do without generalizations and images, then GIS is a modern computer technology for mapping and analysis of real world objects, as well as events occurring on our planet. This technology combines the traditional operations of working with databases, such as query and statistical analysis, with the benefits of full-fledged visualization and geographical (spatial) analysis that the map provides. These features distinguish GIS from other information systems and provide unique opportunities for its application in a wide range of tasks related to the analysis and prediction of the phenomena and events of the surrounding world, with understanding and identifying the main factors and causes, as well as their possible consequences, with planning strategic decisions and current consequences of actions taken.
Map making and geographic analysis are not completely new. However, GIS technology provides a new, more modern, more efficient, convenient and quick approach to the analysis of problems and solving problems facing humanity as a whole, and a specific organization or group of people in particular. It automates the analysis and forecasting process. Prior to the beginning of the use of GIS, only a few possessed the art of generalizing and fully analyzing geographic information in order to make informed optimal decisions based on modern approaches and tools.
GIS is currently a multimillion-dollar industry that involves hundreds of thousands of people around the world. GIS is studied in schools, colleges and universities. This technology is used in almost all spheres of human activity - whether it be analysis of global problems such as overpopulation, pollution of the territory, reduction of forest land, natural disasters, or solving particular problems, such as finding the best route between points, choosing the optimal location for a new office, searching houses at his address, laying a pipeline on the ground, various municipal tasks.
GIS components
A working GIS includes five key components: hardware, software, data, artists, and methods.
Hardware. This is the computer on which the GIS is running. GIS currently runs on various types of computer platforms, from centralized servers to single or networked desktop computers.
GIS software contains the functions and tools necessary for storing, analyzing and visualizing geographic (spatial) information. The key components of software products are: tools for entering and operating geographical information; database management system (DBMS or DBMS); tools for supporting spatial queries, analysis and visualization (display); graphical user interface (GUI or GUI) for easy access to tools.
Data. This is probably the most important component of a GIS. Spatial location data (geographic data) and associated tabular data can be collected and prepared by the user, or purchased from suppliers on a commercial or other basis. In the process of managing spatial data, a GIS integrates spatial data with other types and sources of data, and can also use DBMSs used by many organizations to organize and maintain the data at their disposal.
Performers. Widespread use of GIS technology is impossible without people who work with software products and develop plans for their use in solving real problems. GIS users can be both technical specialists who develop and maintain the system, as well as ordinary employees (end users), whom the GIS helps to solve current everyday affairs and problems.
Methods The success and effectiveness (including economic) of the use of GIS in many respects depends on a correctly drawn up plan and rules of work, which are compiled in accordance with the specifics of the tasks and work of each organization.
How does GIS work?
GIS stores information about the real world in the form of a set of thematic layers, which are combined based on geographical location. This simple but very flexible approach has proved its worth in solving a variety of real-world problems: for tracking the movement of vehicles and materials, for a detailed display of the real situation and planned events, for modeling global atmospheric circulation.
Any geographical information contains information about the spatial position, whether it is a reference to geographical or other coordinates, or links to an address, postal code, constituency or district census, the identifier of a land or forest plot, the name of the road, etc. When using such links, a procedure called geocoding is used to automatically determine the location or locations of an object (s). With its help, you can quickly determine and see on the map where the object or phenomenon you are interested in is located, such as the house where your friend lives or the organization you need, where the earthquake or flood occurred, which route makes it easier and faster to get to the point you need or at home.
Vector and raster patterns.GIS can work with two significantly different types of data - vector and raster. In a vector model, information about points, lines, and polygons is encoded and stored as a set of X, Y coordinates. The location of a point (point object), such as a borehole, is described by a pair of coordinates (X, Y). Line features, such as roads, rivers, or pipelines, are stored as X, Y coordinate sets. Polygonal objects, such as river catchments, land, or service areas, are stored as a closed set of coordinates. The vector model is especially convenient for describing discrete objects and less suitable for describing continuously changing properties, such as soil types or the availability of objects. The raster model is optimal for working with continuous properties. A raster image is a set of values \u200b\u200bfor individual elementary components (cells), it is similar to a scanned map or picture. Both models have their advantages and disadvantages. Modern GIS can work with both vector and raster models.
The tasks that GIS solves.A general-purpose GIS, among other things, usually performs five procedures (tasks) with data: input, manipulation, management, query and analysis, visualization.
InputFor use in GIS, data must be converted to a suitable digital format. The process of converting data from paper cards to computer files is called digitization. In modern GIS, this process can be automated using scanner technology, which is especially important when carrying out large projects, or, with a small amount of work, data can be entered using a digitizer. Many data has already been converted to formats directly perceived by GIS packages.
Manipulation.Often, to carry out a specific project, the available data must be further modified in accordance with the requirements of your system. For example, geographic information can be on different scales (the centerlines of the streets are on a scale of 1: 100,000, the boundaries of census districts are on a scale of 1: 50,000, and residential properties are on a scale of 1: 10,000). For joint processing and visualization, all data is more convenient to present on a single scale. GIS technology provides different ways to manipulate spatial data and extract the data needed for a specific task.
Control.In small projects, geographic information can be stored as regular files. But with an increase in the amount of information and an increase in the number of users for storing, structuring and managing data, it is more efficient to use database management systems (DBMS), then special computer tools for working with integrated data sets (databases). In a GIS, it is most convenient to use a relational structure in which data is stored in tabular form. At the same time, common fields are used to link tables. This simple approach is quite flexible and is widely used in many GIS and non-GIS applications.
Request and analysis.If you have GIS and geographic information, you can get answers to simple questions (Who is the owner of this land plot? At what distance are these objects located from each other? Where is this industrial zone located?) And more complex requests requiring additional analysis (Where are there places for construction new home? What is the main soil type under spruce forests? How will the construction of a new road affect traffic?). Requests can be set as a simple click on a specific object, or with the help of advanced analytical tools. Using GIS, you can identify and set patterns for search, play scripts of the type “what will happen if ...”. Modern GIS have many powerful tools for analysis, two of which are most significant: proximity analysis and overlay analysis. To analyze the proximity of objects relative to each other in a GIS, a process called buffering is used. It helps answer questions like: How many houses are within 100 meters of this body of water? How many customers live within 1 km of this store? What is the proportion of oil produced from wells located within 10 km of the management building of this NGDU? The overlay process involves the integration of data located in different thematic layers. In the simplest case, this is a mapping operation, but for a number of analytical operations, data from different layers are combined physically. Overlapping, or spatial aggregation, allows, for example, integrating data on soils, slope, vegetation, and land tenure with land tax rates.
Visualization.For many types of spatial operations, the end result is the presentation of data in the form of a map or graph. A map is a very effective and informative way of storing, presenting and transmitting geographic (georeferenced) information. Maps used to be created for centuries. GIS provides amazing new tools that expand and develop the art and scientific foundations of cartography. With its help, the visualization of the cards themselves can be easily supplemented by reporting documents, three-dimensional images, graphs and tables, photographs and other means, for example, multimedia.
Related technology.GIS is closely related to a number of other types of information systems. Its main difference is the ability to manipulate and analyze spatial data. Although there is no common universally accepted classification of information systems, the description below should help to distance GIS from desktop mapping, CAD systems, remote sensing, database management systems (DBMS or DBMS) and technology global positioning (GPS).
Desktop Mapping Systemsuse a cartographic representation to organize user interaction with data. In such systems, everything is based on maps; a map is a database. Most desktop mapping systems have limited data management, spatial analysis, and customization capabilities. The corresponding packages work on desktop computers - PCs, Macintosh and lower UNIX workstation models.
CAD systemscapable of project drawings and building plans and infrastructure. To combine into a single structure, they use a set of components with fixed parameters. They are based on a small number of rules for combining components and have very limited analytical functions. Some CAD systems have been expanded to support the cartographic representation of data, but, as a rule, the utilities available in them do not allow you to efficiently manage and analyze large spatial databases.
Remote Sensing and GPS.Remote sensing methods are an art and a scientific field for conducting measurements of the earth's surface using sensors, such as various cameras on board aircraft, global positioning system receivers or other devices. These sensors collect data in the form of images and provide specialized processing, analysis and visualization capabilities of the received images. Due to the lack of sufficiently powerful data management and analysis tools, the corresponding systems can hardly be attributed to real GIS.
Database management systemsdesigned to store and manage all types of data, including geographic (spatial) data. DBMSs are optimized for such tasks, therefore, many DBMSs have built-in DBMS support. These systems do not have GIS-like tools for analysis and visualization.
What can GIS do for you?
Make spatial queries and analyze.The ability of GIS to search databases and perform spatial queries has allowed many companies to save millions of dollars. GIS helps reduce the time to receive responses to customer requests; identify areas suitable for the required activities; identify relationships between various parameters (e.g., soil, climate, and crop yield); identify places of power outages. Realtors use GIS to search, for example, all houses in a certain area that have slate roofs, three rooms and 10-meter kitchens, and then give a more detailed description of these buildings. The request can be refined by introducing additional parameters, for example, cost parameters. You can get a list of all houses located at a certain distance from a particular highway, forest park or place of work.
Improve integration within the organization.Many organizations that use GIS have found that one of its main advantages is new opportunities for improving the management of their own organization and its resources based on the geographical combination of available data and the possibility of their sharing and coordinated modification by different departments. The possibility of sharing and the database constantly being expanded and corrected by different structural divisions makes it possible to increase the efficiency of both each division and the organization as a whole. So, a company engaged in engineering communications can clearly plan repair or maintenance work, starting with obtaining complete information and displaying on the computer screen (or on paper copies) of the relevant sections, for example, water supply, and ending with the automatic determination of the inhabitants who will be affected by these works, and notifying them of the timing of the alleged outages or interruptions in the water supply.
Making more informed decisions.GIS, like other information technologies, confirms the well-known saying that better awareness helps make a better decision. However, GIS is not a tool for issuing decisions, but a tool to help speed up and increase the efficiency of decision-making procedures, providing answers to queries and functions of analyzing spatial data, presenting the results of the analysis in a clear and easy to read form. A GIS helps, for example, in solving problems such as providing a variety of information at the request of planning authorities, resolving territorial conflicts, choosing optimal (from different points of view and according to different criteria) locations for objects, etc. Information required for making decisions can be presented in a concise cartographic form with additional textual explanations, graphs and diagrams. The availability of information that is accessible for perception and generalization allows responsible employees to focus their efforts on finding a solution without spending significant time on collecting and thinking about the available heterogeneous data. You can quickly consider several solutions and choose the most effective and effective.
Creation of cards.Maps in GIS have a special place. The process of creating maps in GIS is much simpler and more flexible than in traditional methods of manual or automatic mapping. It starts by creating a database. As a source of source data, you can use the digitization of conventional paper cards. GIS-based cartographic databases can be continuous (without dividing into separate sheets and regions) and not related to a specific scale. On the basis of such databases, it is possible to create maps (in electronic form or as hard copies) to any territory, of any scale, with the desired load, with its selection and display with the required symbols. At any time, the database can be updated with new data (for example, from other databases), and the data available in it can be adjusted as necessary. In large organizations, the created topographic database can be used as a basis by other departments and divisions, while it is possible to quickly copy data and transfer it over local and global networks.
Geographic Information System (GIS, also geographic information system) - these are electronic spatially-oriented images (maps, schemes, plans, etc.) and databases integrated in a single information environment. GIS includes the capabilities of database management systems (DBMS), editors of raster and vector graphics and analytical tools and are used in cartography, geology, meteorology, land management, ecology, municipal administration, transport, economics, defense and many other areas.
According to the territorial scope, there are global GIS (GIS), subcontinental GIS, national GIS, often having the status of state, regional GIS (regional GIS), subregional GIS and local, or local GIS (local GIS).
How GIS Works
GIS stores information about the real world in the form of a set of thematic layers, which are combined based on geographical location. This simple but very flexible approach has proved its worth in solving a variety of real-world problems: for tracking the movement of vehicles and materials, for a detailed display of the real situation and planned events, for modeling global atmospheric circulation.
Any geographical information contains information about the spatial position, whether it is a reference to geographical or other coordinates, or links to an address, postal code, constituency or district census, land or forest area identifier, road name or kilometer post on the highway, etc. .
gIS layered geographic information
GIS Key Benefits
- user-friendly display of spatial data
Mapping spatial data, including in three-dimensional measurement, is most convenient for perception, which simplifies the construction of queries and their subsequent analysis. - internal data integration
Geographic information systems combine the data accumulated in various departments of the company or even in different areas of activity of organizations of the whole region. The collective use of the accumulated data and their integration into a single information array provides significant competitive advantages and increases the efficiency of the operation of geographic information systems. - informed decision making
Automation of the process of analysis and reporting on any phenomena associated with spatial data helps to speed up and increase the efficiency of decision-making. - handy map maker
Geographic information systems optimize the process of decoding data from space and aerial surveys and use already created terrain plans, diagrams, and drawings. GIS significantly save time resources by automating the process of working with maps, and create three-dimensional terrain models.
GIS industry use
The capabilities of geographic information systems can be used in various fields of activity. Here are just some examples of using GIS:
administrative-territorial administration
- urban planning and design facilities;
- maintaining cadastres of engineering communications, land, urban planning, green spaces;
- forecast of emergency situations of technogenic and environmental nature;
- management of traffic flows and routes of urban transport;
- building environmental monitoring networks;
- engineering and geological zoning of the city.
telecommunications
- trunk and cellular communications, traditional networks;
- strategic planning of telecommunication networks;
- selection of the optimal location of antennas, repeaters, etc .;
- definition of routes of cable laying;
- network status monitoring;
- operational dispatch control.
engineering Communication
- assessment of needs for water supply and sewerage networks;
- modeling the effects of natural disasters on utilities;
- engineering network design;
- monitoring the state of utility networks and preventing emergencies.
transport
- automobile, railway, water, pipeline, air transport;
- management of transport infrastructure and its development;
- fleet management and logistics;
- traffic management, route optimization and cargo flow analysis.
oil and gas complex
- exploration and field survey work;
- monitoring of technological modes of oil and gas pipelines;
- design of trunk pipelines;
- modeling and analysis of the consequences of emergency situations.
power departments
- rapid response services, armed forces, police, fire services;
- planning of rescue operations and security measures;
- emergency modeling;
- strategic and tactical planning of military operations;
- navigation of quick response services and other law enforcement agencies.
ecology
- assessment and monitoring of the state of the environment;
- modeling of environmental disasters and analysis of their consequences;
- environmental planning.
forestry
- strategic forestry management;
- logging management, planning approaches to the forest and road design;
- forest inventory management.
agriculture
- farmland planning;
- registration of landowners and arable land;
- optimization of transportation of agricultural products and mineral fertilizers.
GIS Examples
Google earth
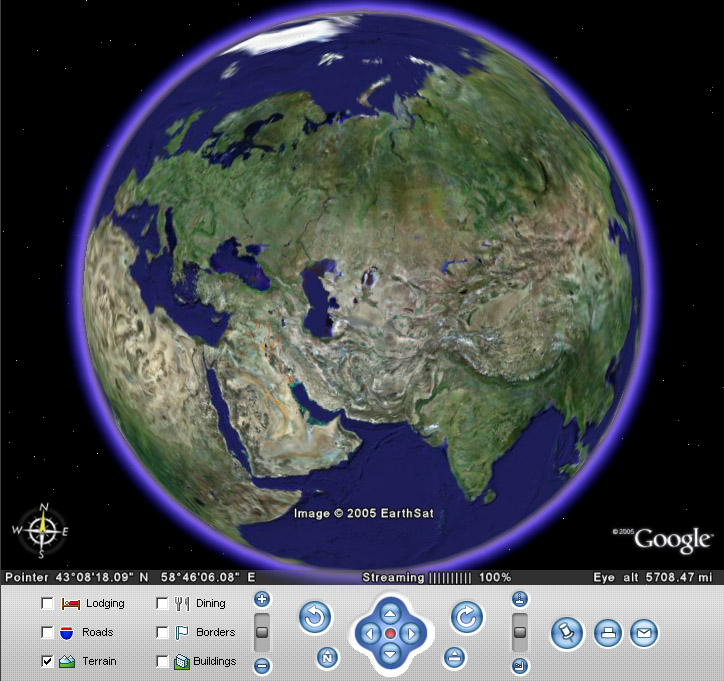
Google’s project, in which satellite images of the entire earth’s surface were posted on the Internet. Photos of some regions have unprecedented high resolution.
Unlike other similar services that display satellite images in a regular browser (for example, Google Maps), this service uses a special Google Earth client program downloaded to the user's computer. Although this approach requires downloading and installing the program, it further provides additional features that are difficult to implement using the web interface. This program was originally released by Keyhole, and then purchased by Google, which made the program publicly available. There are also paid versions of Google Earth Plus and Google Earth Pro, featuring support for GPS navigation, presentation tools and higher print resolution.
Opportunities:
- Google Earth automatically downloads images and other data necessary for the user from the Internet, saves them in the computer's memory and on the hard disk for future use. Downloaded data is saved to disk, and at subsequent program launches only new data is downloaded, which can significantly save traffic.
- To visualize the image, a three-dimensional model of the entire globe is used (taking into account altitude), which is displayed on the screen using DirectX or OpenGL interfaces. It is in the three-dimensional landscapes of the Earth’s surface that the main difference between the Google Earth program and its predecessor Google Maps is. The user can easily move anywhere in the world by controlling the position of the “virtual camera”.
- Almost the entire land surface is covered with images obtained from DigitalGlobe and having a resolution of 15 m per pixel. There are separate surface areas (usually covering capitals and some large cities of most countries of the world) that have a more detailed resolution. For example, Moscow was shot with a resolution of 0.6 m / pc, and many US cities with a resolution of 0.15 m / pc. Landscape data have a resolution of about 100 m.
- There is also a huge amount of additional data that can be connected at the request of the user. For example, the names of settlements, bodies of water, airports, roads, railways, and other information. In addition, for many cities there is more detailed information - street names, shops, gas stations, hotels, etc. There is a geodata layer (synchronized via the Internet with the appropriate database), which displays (with spatial reference) links to articles from Wikipedia. In Russia, you can see the names of the streets of all cities in the central regions.
- Users can create their own tags and overlay their images on top of satellite (these may be maps, or more detailed images obtained from other sources). These tags can be exchanged with other users of the program through the Google Earth Community forum. Tags sent to this forum become visible to all Google Earth users in about a month.
- The program has a layer of “3D Buildings”, with three-dimensional models added by developers or users themselves, through the 3D Warehouse service. In the cities of Russia, you can find models of some significant architectural monuments.
- There is also a simplified Java version of the program for cell phones.
- There is a function of measuring distances.
- In version 4.2, Google Sky technology appeared, allowing you to view the starry sky.
- In version 5.0, the ability to view a three-dimensional map of the bottom of the seas and oceans was introduced.
GeoMedia technology is a new generation GIS architecture that allows you to work directly without import / export simultaneously with a variety of spatial data in various formats. This is achieved by using special data access components - Intergraph GeoMedia Data Server.
It allows you to visualize and analyze spatial information (search, filtering by condition, dynamic visualization by condition or from changing information in the database, buffer zones, statistics, proximity analysis, topological analysis (such as “is object A inside object B”, etc.) and many others), preparing maps for printing. For end users (not GIS designers and administrators), querying by template in a customized work session environment. Directly (without conversion or corruption at this moment of data) it is connected to the following information sources (servers and files in the corresponding formats): ArcGIS, MapInfo, MGE, GeoMedia (storage on the Microsoft Access platform, Microsoft SQL Server, Oracle Server), universal databases Oracle Server, IBM DB2, and Microsoft SQL Server data, vector maps or graphics in MicroStation (Bentley Systems), AutoCAD (Autodesk) formats, etc., raster data (with and without geo-referencing) such as aerospace images and scanned paper materials in formats TIFF, JPEG, CIT, RLE, etc., WMS Web servers, spreadsheets, ODBC tabular data sources even ASCII text (as a full repository, but, of course, formatted). Not suitable for editing and / or creating data (digital maps).
NASA World Wind
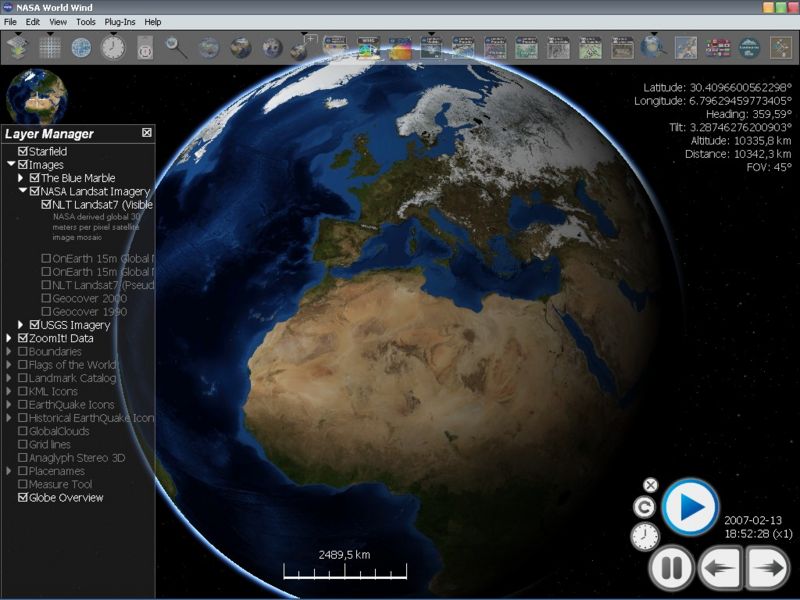
A fully three-dimensional interactive virtual globe created by NASA. Uses NASA satellite imagery and USGS aerial photography to build 3D models of the planet. Initially, the program contains low-resolution cards. When approaching some area of \u200b\u200binterest on the map, high-resolution images are downloaded from NASA servers.
The program allows you to choose the scale, direction and angle of view, visible layers, search by geographical names. It is possible to display the names of geographical objects and political borders.
The function of zooming is implemented in World Wind as a change in the height from which the camera looks at the surface. From a great height, the image looks flat, but from a height of several tens of kilometers in the mountains, the effect of perspective is clearly noticeable, and the smooth scrolling of the image gives the impression of a flight over real terrain.
In addition to the image of the Earth, the program also shows the surface of the moon. Images were obtained from the Clementine satellite, launched in 1994 and taken about 1.8 million images during this time. NASA World Wind allows you to observe the moon at almost any point on it, adjusting the proximity of the image. The relief of a natural satellite, mountains, craters and crevices is clearly visible in the image. Some images are so detailed that it makes it possible to customize the appearance of the surface of the moon from twenty meters.
gvSIG

Free geographic information system with open source. The first working version appeared at the end of 2006 and was distributed via the Internet. It is a geographic information management toolkit with an intuitive interface that works great with both raster and vector formats. gvSIG is being developed with a government grant from Spain.
The program supports all the necessary GIS functions:
- Working with layers, thanks to which you can display only the objects that are currently needed;
- Map scaling functions;
- Support for saving necessary map angles;
- Automatic calculations of the distance between objects and areas of areas;
- Placing active objects on the map;
- Creation of professional geographic maps with the necessary elements that can subsequently be printed.
Arcgis
 The family of software products of the American company ESRI, one of the leaders in the global market for geographic information systems. ArcGIS is based on COM, .NET, Java, XML, SOAP technologies. The latest version is ArcGIS 10.
ArcGIS allows you to visualize (present as a digital map) large volumes of statistical information that has a geographic reference. Maps of all scales are created and edited in the environment: from land plots to the world map.
ArcGIS also has a wide range of spatial information analysis tools.
ArcGis is used in a wide variety of areas:
- Land Registry, land management
- Real estate accounting (see: AIS of real estate accounting, ISOGD)
- Engineering Communication
- Ministry of Internal Affairs and Ministry of Emergencies
- Telecommunications
- Oil and gas
- Ecology
- State Border Service
- Transport
- Forestry
- Water resources
- Remote sensing
- Subsoil use
- Geodesy, cartography, geography
- Business
- Trade and services
- Agriculture
- Education
It should be noted that GRASS GIS is one of the oldest geographic information systems. Its development was initiated by the laboratory of U. S. Army Construction Engineering Research in 1982. In 1995, the GRASS source code was published under the GPL.
The main feature of GRASS is a modular structure that allows you to form from individual functional units of GIS, optimized for the needs of the end user.
The main groups of modules:
- visualization;
- interaction with DBMS (storage of spatial and attribute information);
- image processing (processing satellite images, creating composite images, geometric and chromatic correction);
- print management;
- work with raster maps (shade-models, scaling);
- work with vector maps (spatial analysis operations, attribute queries);
- and etc. GeoMedia is both a GIS technology and a family of GIS products.GeoMedia technology is the next generation GIS architecture that allows you to work directly without import / export simultaneously with a variety of spatial data in various formats. This is achieved by using special data access components - Intergraph GeoMedia Data Server.Today, GeoMedia users have access to components for all major industrial formats of digital map data storage: ArcInfo, ArcView, ASCII, AutoCAD, FRAMME, GeoMedia, GML, MapInfo, MGE, MicroStation, Oracle Spatial, etc., including raster, tabular and multimedia data . At the same time, users can develop their own GeoMedia Data Server based on a template for an arbitrary format. Intergraph GeoMedia Data Server components allow you to see and simultaneously analyze data from an arbitrary number of sources stored in different formats, coordinate systems with different accuracy on one map.Liked this:
ActiveMap GS provides effective management of workflows and resources based on cartographic information. Setting tasks with exact coordinates, appointing responsible employees and monitoring the progress of work minimizes downtime and increases productivity.
GIS 6 Web Edition
GIS 6 Web Edition allows you to significantly expand the mobility of the use of GIS 6 data, as well as the capabilities of the system. Now access to information can be performed from any device with access to the Internet or within the corporate network. The server part of the WEB solution can be deployed both in MS Windows and Unix systems. The system allows you to edit, create and print templates for reporting forms in the Web interface.
GismapServer
Map server for GIS6 and MapDraw 2. Allows you to significantly speed up the process of image formation for the client, free up local network traffic, as well as secure access to vector and graphic data on the server. GisMapServer can also be used as a map Internet server.
GM Tool Kit
The GM Tool Kit software is intended for specialists involved in the configuration and maintenance of the IR2100 and S4100C hydrocarbon sensors widely used in industry by General Monitors. The programs included in the GM Tool Kit allow you to quickly diagnose equipment in the modbus network or a separate sensor, configure the necessary parameters, identify and clarify malfunctions, help configure the modbus network and software.
Korpro
The KORPRO program implements the correlation method of separation of anomalies (COMR), designed to analyze geophysical fields, which are a superposition of many effects with limited a priori information about the studied geological characteristics. The KOMR method allows, under favorable geological and geophysical conditions, to predict any geological characteristic where it is still unknown based on an analysis of the totality of several geophysical parameters.